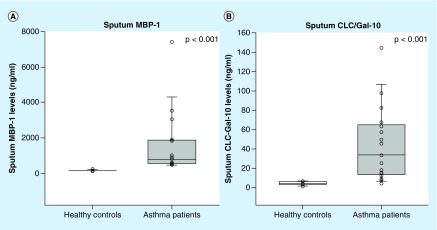
Figure 2. . Box-whisker plots of sputum eosinophil biomarkers of healthy controls (white bars; n = 11) and asthma patients (gray bars; n = 17).
(A) Sputum MBP-1 was measured by sandwich ELISA. Asthma patients had significantly higher levels of MBP-1 compared with healthy controls. (B) Sputum CLC/Gal-10 was measured by sandwich ELISA. Asthma patients had significantly higher levels of CLC/Gal-10 compared with healthy controls.

