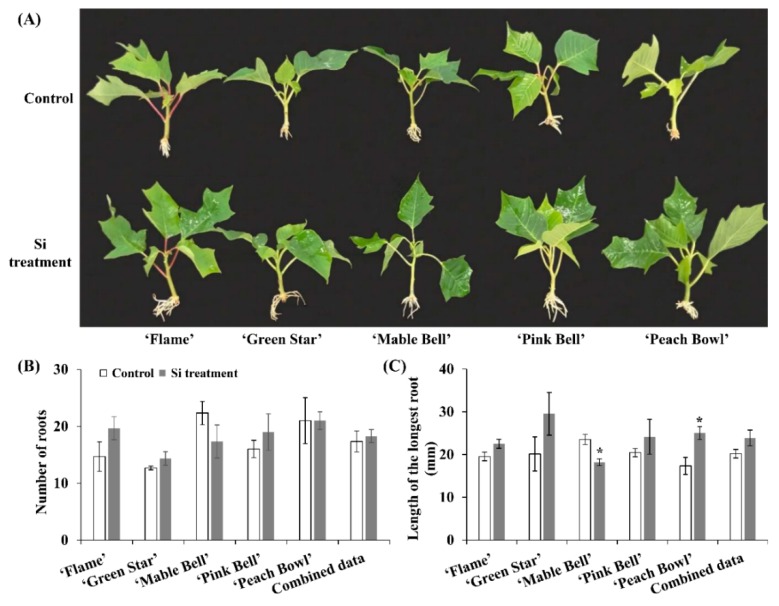
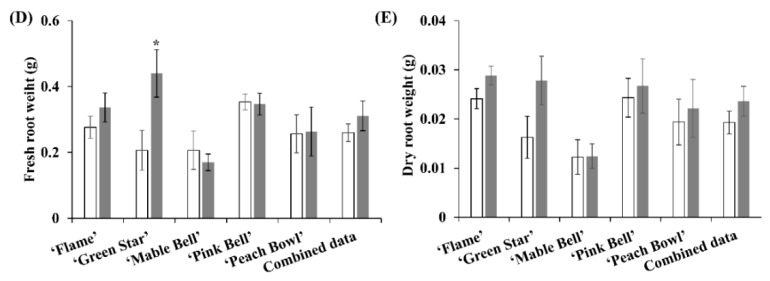
Figure 2.
The root development (A), number of roots (B), length of the longest root (C), fresh root weight (D), and dry root weight (E) of the control and Si-treated poinsettia cultivars. Data were represented by the mean ± SE (bars). Combined data is the average value of all the cultivars. Asterisks represent significant differences between control and Si treatment according to Student’s t-test (P ≤ 0.05).


