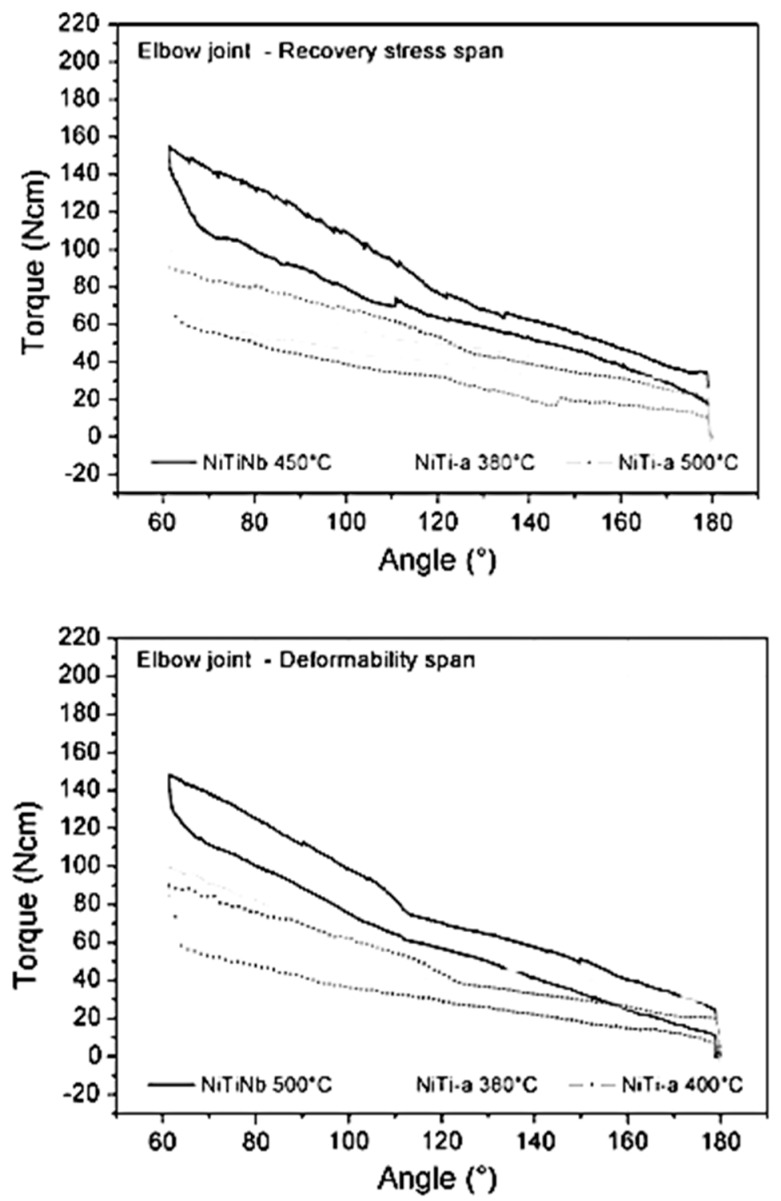
Figure 12.
Torque–angle curves for the hinges mounting several different pseudoelastic springs. The graph above shows curves for a selection of hinges with pseudoelastic elements ranging across recovery stress levels; the graph below displays hinge properties for pseudoelastic elements spanning the plateau lengths [33].

