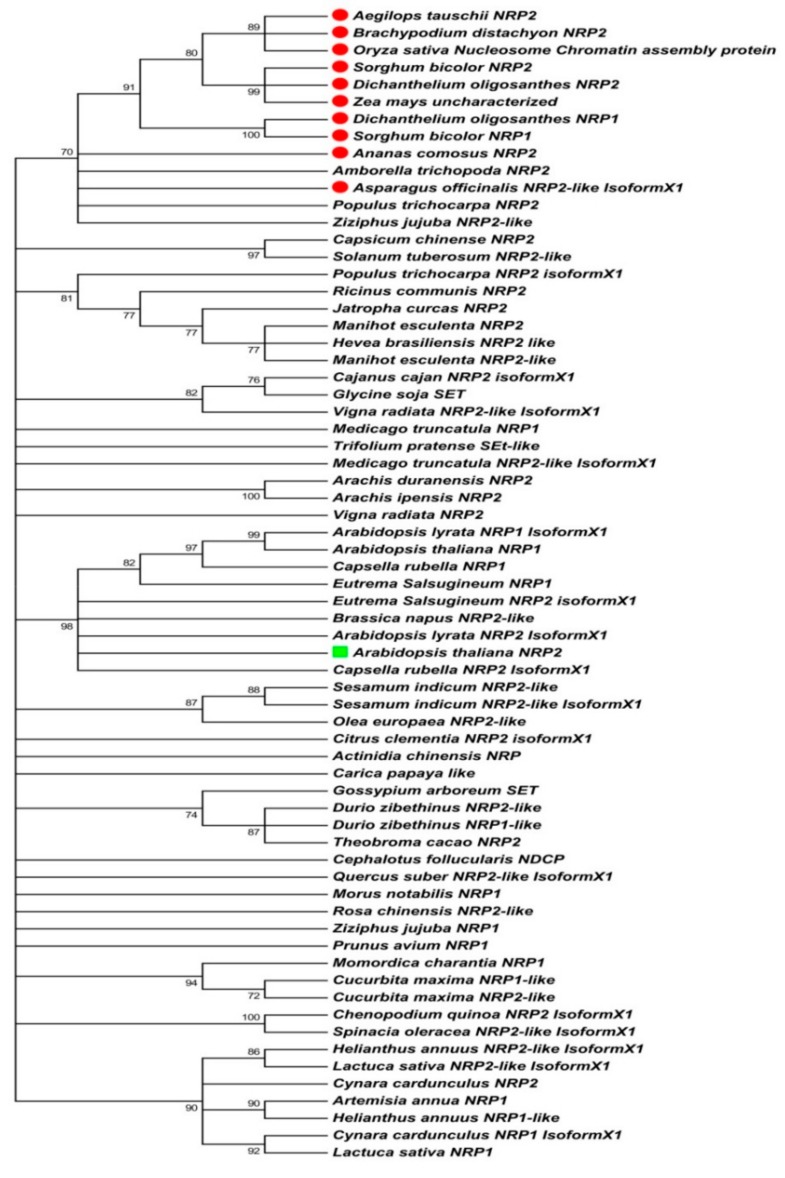
Figure 1.
Molecular phylogenetic analysis of NAP1-Related Proteins (NRPs) by maximum likelihood method. The evolutionary history was inferred by using the maximum likelihood method based on the Poisson correction model. The bootstrap consensus tree derived from 1200 replicates was taken to represent the evolutionary history of the taxa analyzed. Branches corresponding to partitions reproduced in less than 70% bootstrap replicates were collapsed. The percentage of replicate trees in which the associated taxa clustered together in the bootstrap test (1200 replicates) are shown next to the branches. Initial tree(s) for the heuristic search were obtained automatically by applying Neighbor-Join and BioNJ algorithms to a matrix of pairwise distances estimated using Jones-Taylor-Thornton (JTT) model, and the topology selected with superior log-likelihood value. The analysis involved 67 amino acid sequences. All positions containing gaps and missing data were eliminated. There were a total of 178 positions in the final dataset. Evolutionary analyses were conducted using MEGA 7.0 software. In the phylogenetic tree, NRPs from monocots are highlighted using a red circle and AtNRP2 with a green square.

