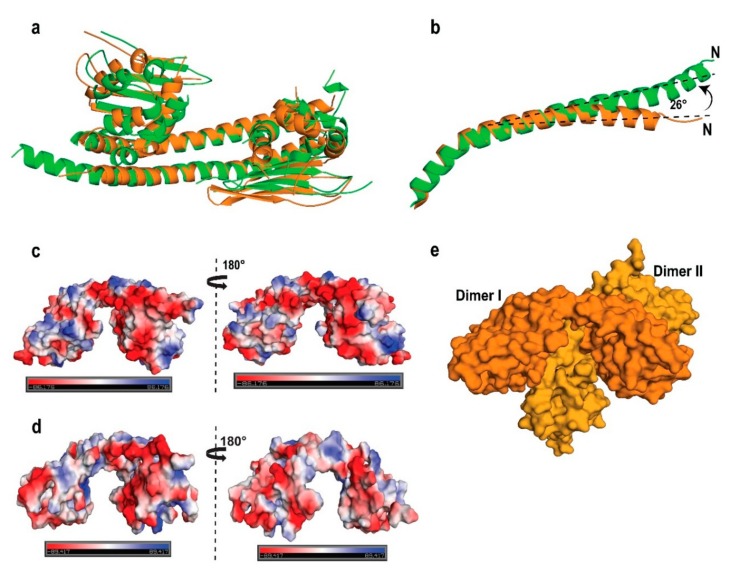
Figure 5.
Comparison of AtNRP2 and AtNRP1 structures. (a) Superposition of the crystal structures of AtNRP1 (PDB id: 5DAY; Green) and AtNRP2 (Orange). The r.m.s.d. value observed for the structural superposition was 3.24 Å for 323 Cα atoms. (b) Representation of the superimposed dimerization helix of AtNRP2 and AtNRP1 monomers, revealing the shift in the helix. (c) Surface electrostatic potential of AtNRP1 in two orientations, representing electronegative (red), electropositive (blue) and neutral (white) areas. (d) Surface electrostatic potential of AtNRP2 representing electronegative (red), electropositive (blue), and neutral (white) areas. (e) The surface representation of AtNRP2 tetramer obtained by generation of symmetry mates.

