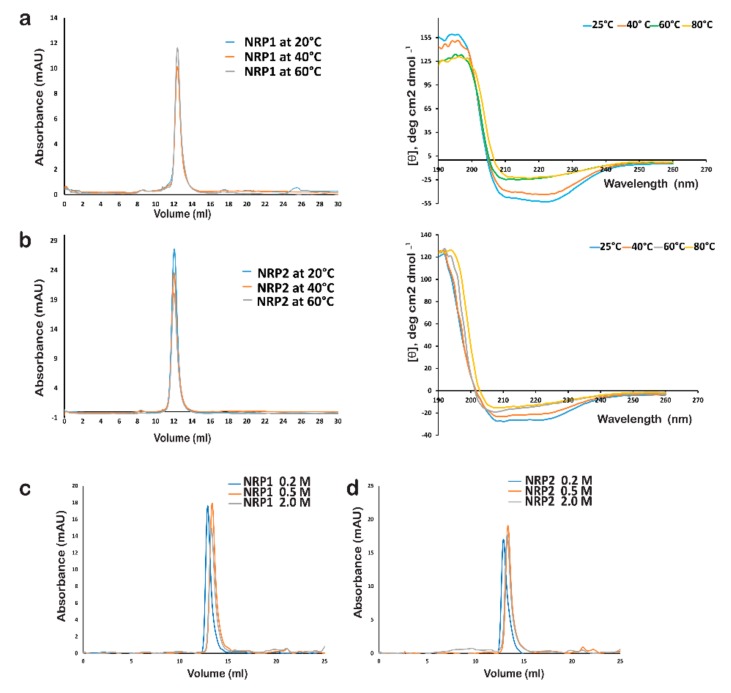
Figure 8.
Analysis of AtNRP1 and AtNRP2 stability. Analytical gel-filtration chromatograms (left panel) and Far-UV CD curves (right panel) for the full-length forms of (a) AtNRP1, and (b) AtNRP2, showing the elution of the respective proteins at the same position, irrespective of heating at different temperatures and Far-UV CD curves for 25, 40, 60, and 80 °C respectively, showing no major change in secondary structure at the respective temperatures. Analytical gel-filtration chromatogram for the full-length forms of (c) AtNRP1, and (d) AtNRP2 showing the elution of the respective proteins at the same position, irrespective of the salt concentrations. All the gel-filtration experiments were carried out in a buffer containing 20 mM Tris-HCl (pH 8.0), but with different concentrations of NaCl (0.2, 0.5, and 2.0 M) using a Superdex 200 10/300 GLcolumn.

