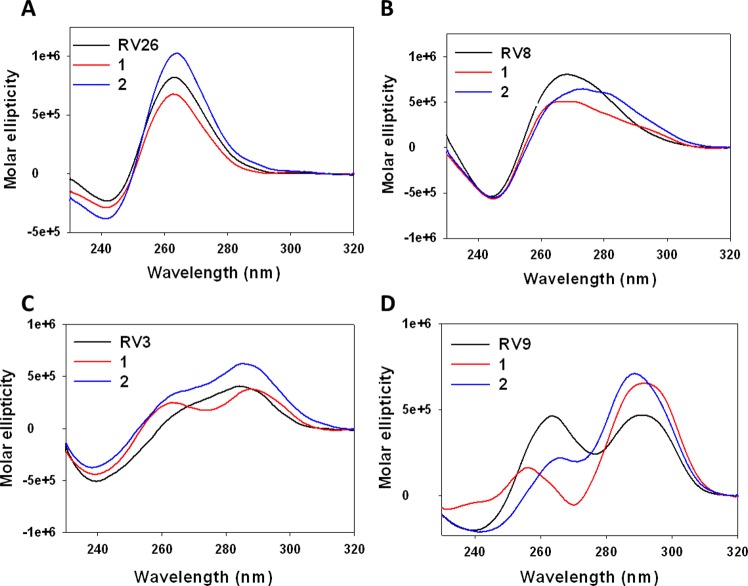
Figure 5.
Representative CD spectra of RV G4 sequences in the absence (black line) or presence of G4 ligands 1 (red line) and 2 (blue line). (A) G4 CD spectrum, characterized by a maximum peak at λ = 260 nm and a minimum one at λ = 240 nm, which define a parallel conformation. (B) Non-G4 CD spectrum, characterized by a broad signal at 260 < λ < 280 nm. (C–D) Two different mixed-G4 CD profiles.

