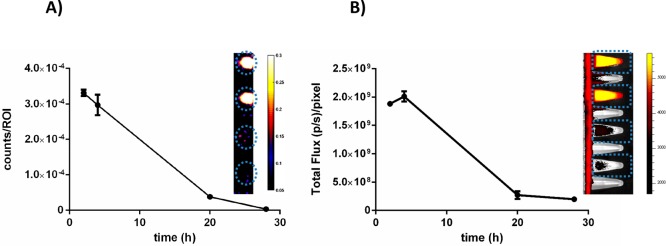
Figure 3.
(A) Dilution of radioactivity of 99mTc-SA during replication in BHI medium. Data are expressed as the radioactivity counts per ROI after correction for the number of viable bacteria per milliliter at the same interval. (B) Dilution of fluorescence of 99mTc-SA during replication in BHI medium. Data are expressed as the total flux ((photons/s)/pixel) per ROI after correction for the number of viable bacteria per milliliter at the same interval. The inserts on both graphs are representative images of (A) SPECT- and (B) IVIS-imaging Eppendorf tubes containing the various dilutions.

