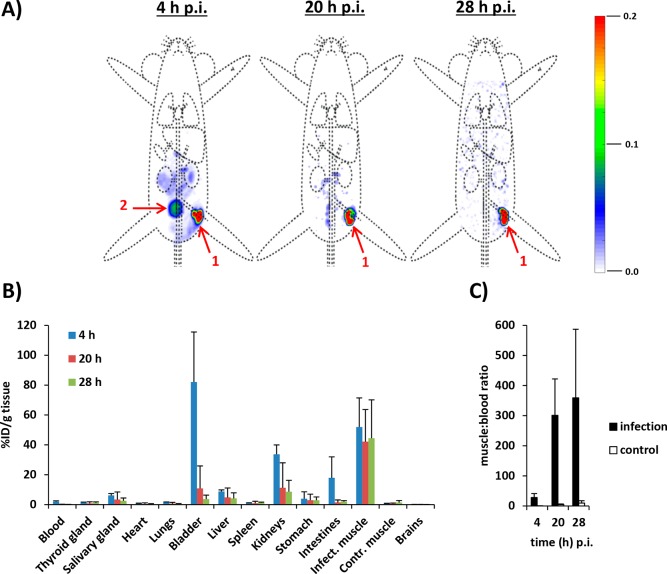
Figure 5.
(A) Time-related (4, 20, and 28 h pi) isotope SPECT imaging of 99mTc-SA in vivo after inoculation in a thigh muscle. Organs are marked as (1) inoculation site and (2) bladder. The scale bars indicate the intensities of radioactivity expressed as arbitrary units. (B) Uptake of 99mTc-SA in various tissues at various intervals after inoculation in a thigh muscle, as determined by radioactivity calculations in excised tissues. Data are expressed as the mean percentages (±SD) of total injected radioactivity per gram of tissue (%ID/g) of three observations. Error bars represent the standard deviations. (C) Muscle-to-blood ratios at various intervals of radioactivity counts obtained from excised tissues.

