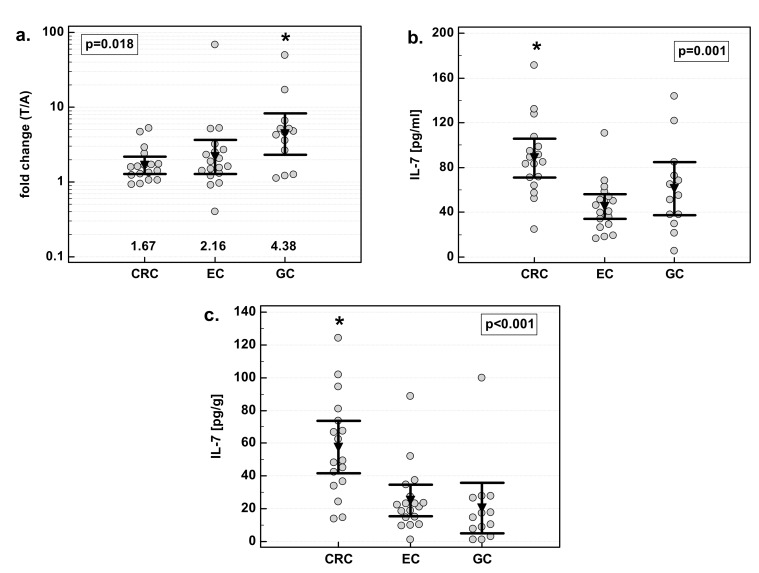
Figure 2.
Effect of tumor location on IL-7: (a) fold change in IL-7 concentration; (b) IL-7 concentration in tumor tissue; (c) IL-7 concentration in adjacent macroscopically normal tissue. Data are expressed as picograms of IL-7 per gram of analyzed tissue. Data were analyzed with one-way ANOVA and presented as means with 95% confidence interval (triangle with whiskers). In case of data presented on the logarithmic scale, nontransformed values of geometric means are additionally given below the dot plots. T/A, tumor-to-adjacent tissue ratio; *, significantly different from other groups.

