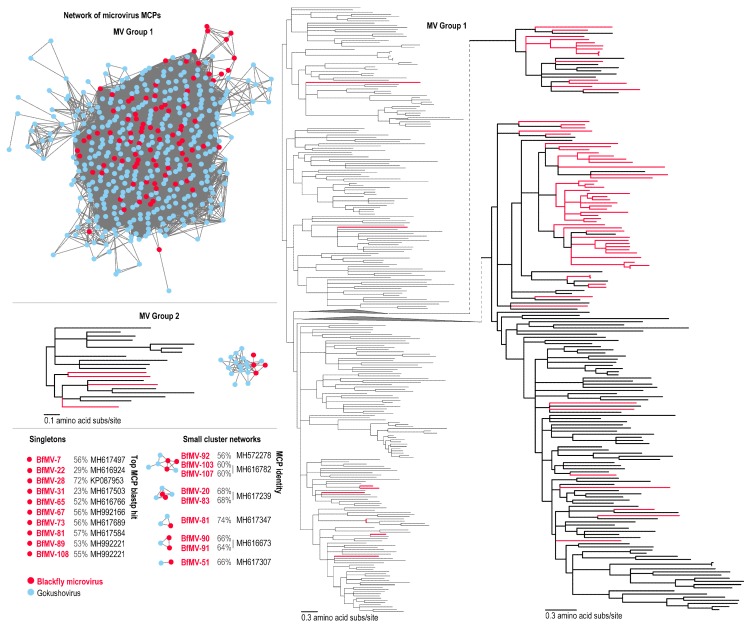
Figure 4.
Network analyses of the microvirus major capsid protein. Maximum likelihood phylogeny of the MCP sequences of microviruses for the two major groups (MV group 1 and 2) are shown. Smaller networks and singletons are shown with closet Rep comparisons and percentage similarities. Blackfly derived sequence are shown in red.

