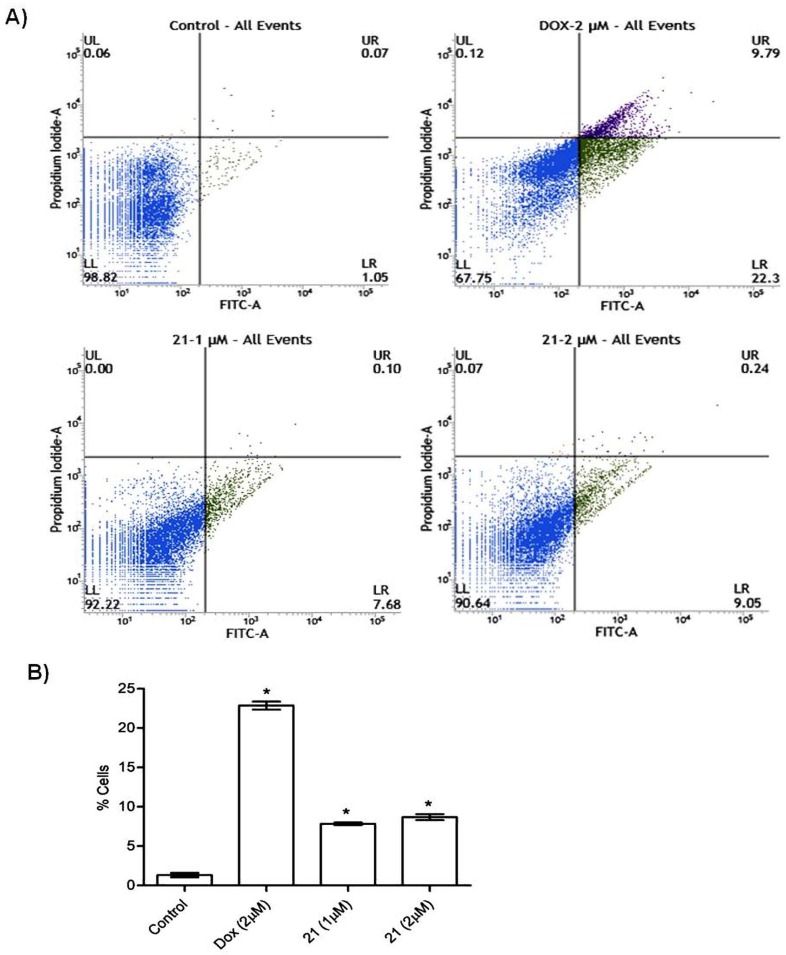
Figure 8.
Annexin V-FITC assay in lung cancer cells A549; (A) Control cells and cells treated with Doxorubicin (2 µM) and barbatic acid (21) at 1 and 2 µM. Lower left (LL) represents live (viable) cells, lower right (LR) represents early apoptotic cells, upper right (UR) represents late apoptotic cells and upper left (UL) represents necrotic cells. (B) Bar graph indicating % apoptotic cells. Values are mean ± SD, n = 3. Tukey’s multiple comparison test followed by ANOVA was applied to compare the differences. * p < 0.0001 vs. control.

