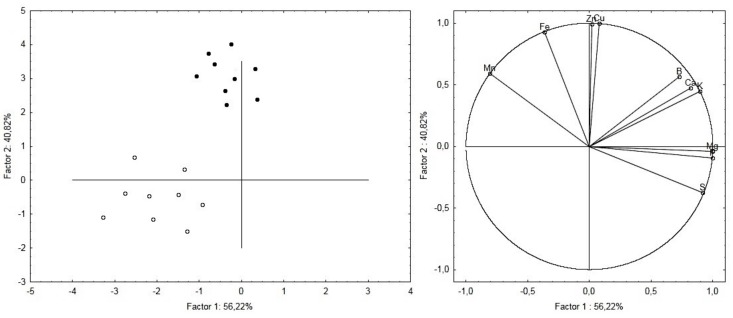
Figure 2.
Principal components analysis (PCA) of the roots ionome. The figure on the Left shows the modification of the roots ionome as a function of the treatment. Filled dots show treated samples whereas empty dots show untreated root samples.The figure on the Right shows the relationship between variables and principal components and also highlights relationships between the variables themselves.

