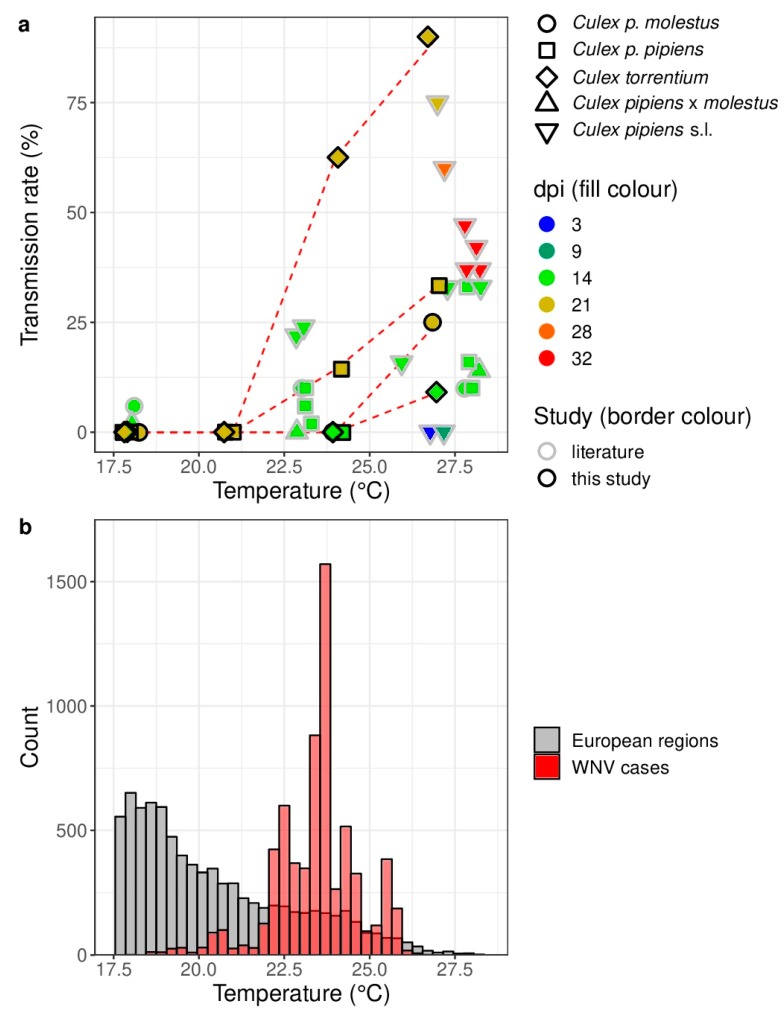
Figure 1.
(a) Transmission rate of Culex pipiens s.l./torrentium experimentally infected with West Nile virus at different temperatures and days post infection (dpi) in comparison to previously published vector competence studies with European populations Culex pipiens s.l [21]. A small horizontal jitter was added to the points to prevent overlapping.; (b) Histograms of the average temperatures in July/August (2011–2018) for all European NUTS 3 (Nomenclature of Territorial Units for Statistics, third level) regions (=gray) and for each detected human WNV case (=red). Count data for the European NUTS 3 regions indicate the cumulative number of times the respective average temperature in July/August was observed over all European NUTS 3 regions for each year from 2011 to 2018. Only the data for the temperatures between 17.5 °C and 28.5 °C are shown.

