Table 1.
Synthesized pirooxindoles and benzo[b]furan scaffolds 5a–r and their biological activity.
| # | Compound | α-Amylase | α-Glucosidase | α-Amylase Selectivity b | α-Glucosidase Selectivity c |
|---|---|---|---|---|---|
| IC50 (μM ± SD) a | |||||
| 1 |
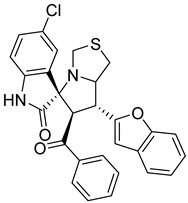 5a
5a
|
693.22 ± 0.10 | 465.12 ± 0.12 | 0.67 | 1.49 |
| 2 |
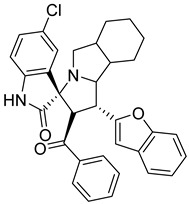 5b
5b
|
747.08 ± 0.34 | 545.01 ± 1.09 | 0.72 | 1.37 |
| 3 |
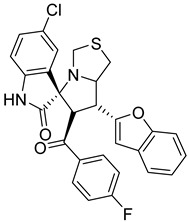 5c
5c
|
718.00 ± 0.27 | 585.11 ± 0.02 | 0.81 | 1.22 |
| 4 |
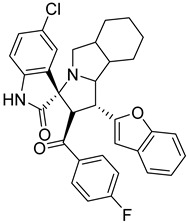 5d
5d
|
728.13 ± 0.28 | 549.17 ± 1.06 | 0.75 | 1.32 |
| 5 |
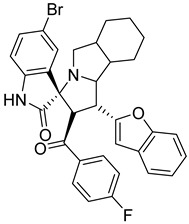 5e
5e
|
710.07 ± 0.10 | 554.12 ± 1.42 | 0.78 | 1.28 |
| 6 |
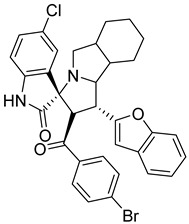 5f
5f
|
670.14 ± 0.10 | 534.04 ± 1.09 | 0.79 | 1.25 |
| 7 |
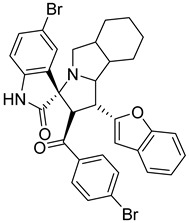 5g
5g
|
690.09 ± 0.06 | 554.12 ± 1.42 | 0.80 | 1.24 |
| 8 |
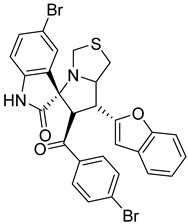 5h
5h
|
589.04 ± 0.25 | 494.10 ± 0.04 | 0.83 | 1.19 |
| 9 |
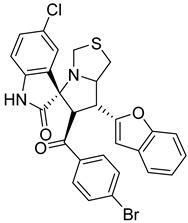 5i
5i
|
779.08 ± 0.51 | 684.12 ± 0.35 | 0.87 | 1.13 |
| 10 |
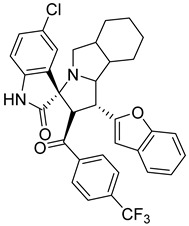 5j
5j
|
39.02 ± 1.73 | 29.20 ± 0.33 | 0.74 | 1.33 |
| 11 |
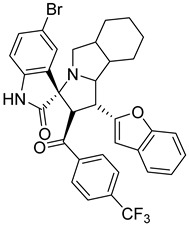 5k
5k
|
49.28 ± 1.09 | 39.10 ± 0.54 | 0.79 | 1.26 |
| 12 |
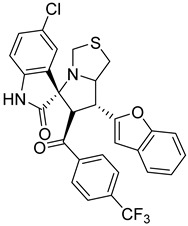 5l
5l
|
558.07 ± 0.18 | 414.12 ± 0.52 | 0.74 | 1.37 |
| 13 |
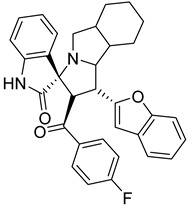 5m
5m
|
95.26 ± 0.27 | 69.11 ± 0.34 | 0.72 | 1.37 |
| 14 |
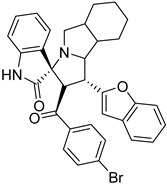 5n
5n
|
185.23 ± 1.06 | 98.23 ± 1.24 | 0.53 | 1.88 |
| 15 |
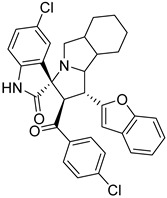 5o
5o
|
115.42 ± 0.07 | 68.18 ± 1.54 | 0.59 | 1.69 |
| 16 |
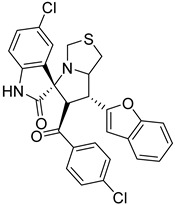 5p
5p
|
488.02 ± 1.11 | 392.13 ± 1.07 | 0.80 | 1.24 |
| 17 |
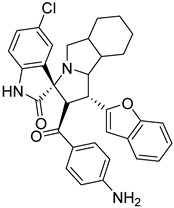 5q
5q
|
37.22 ± 1.49 | 26.29 ± 0.45 | 0.70 | 1.41 |
| 18 |
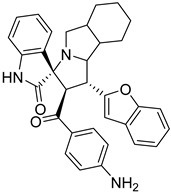 5r
5r
|
22.61 ± 0.54 | 14.05 ± 1.03 | 0.62 | 1.60 |
| STD | Acarbose (μM) | 0.75 + 0.07 | 2.35 + 0.13 | 3.13 | 0.31 |
a α-Amylase and α-glucosidase inhibitory activity is expressed as the mean ± SD of triplicate experiments. b Selectivity for α-amylase is defined as IC50 (α-glucosidase)/IC50 (α-amylase). c Selectivity for α-glucosidase is defined as IC50 (α-amylase)/IC50 (α-glucosidase).
