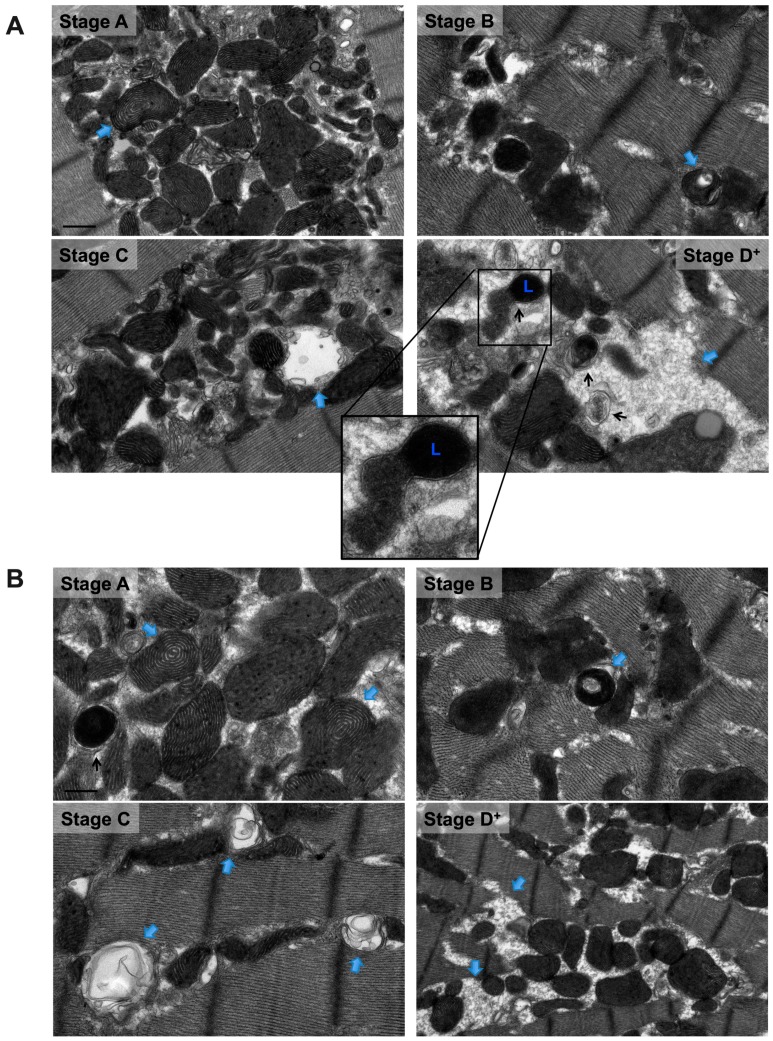
Figure 4.
Transmission electron photomicrographs showing similar morphological stages of mitochondrial vacuolar degeneration in cardiac myocytes overexpressing BNIP3 (A) and constitutively active FOXO3a (B). Blue arrows pointing at mitochondrion at a specific stage of mitochondrial vacuolar degeneration. Black arrows pointing at autophagosomes. Zoomed photomicrograph in A, showing an autophagosome containing a fragmented mitochondrion fusing with a lysosome. L: lysosome. Photomicrographs are 40k × magnified, scale bar 0.5 μm.

