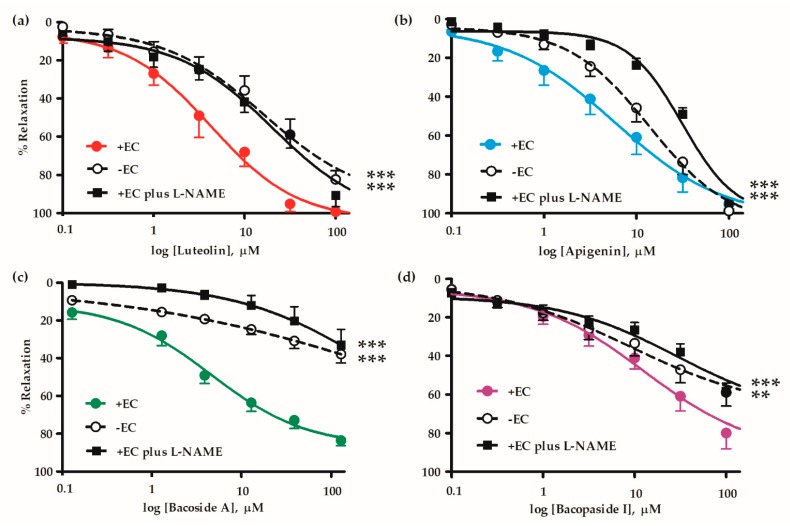
Figure 2.
Cumulative concentration-response curves of (a) luteolin, (b) apigenin, (c) bacoside A and (d) bacopaside I in concentrations (0.1–100 µM) in endothelial intact (+EC), denuded (-EC) mesenteric arterial rings and endothelial intact vessels pre-incubated in L-NAME (100 µM). The graphs are expressed as %relaxation of vessel pre-contracted with 10 µM PE. Values are mean ± SEM of 6–9 individual arteries. ** p < 0.01, *** p < 0.001 each compound compared with intact vessels (+EC) using two-way ANOVA (n = 6–9).

