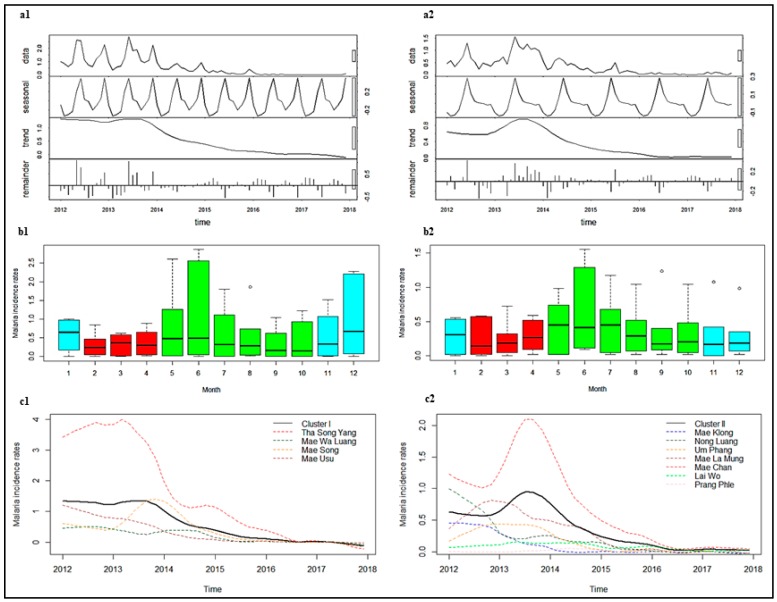
Figure 4.
Seasonal Trend decomposition procedure based on Loess or STL (a), seasonality (b), and trends (c) of P. falciparum among Thai citizens between 2012 and 2017 in Cluster I (1) and Cluster II (2). Color of box plot in b1 and b2: Blue represents the cold season, red represents the hot season, and green represents the rainy season. Note: Y-axes do not show equal values, which should be taken into consideration when performing comparisons.

