Figure 4.
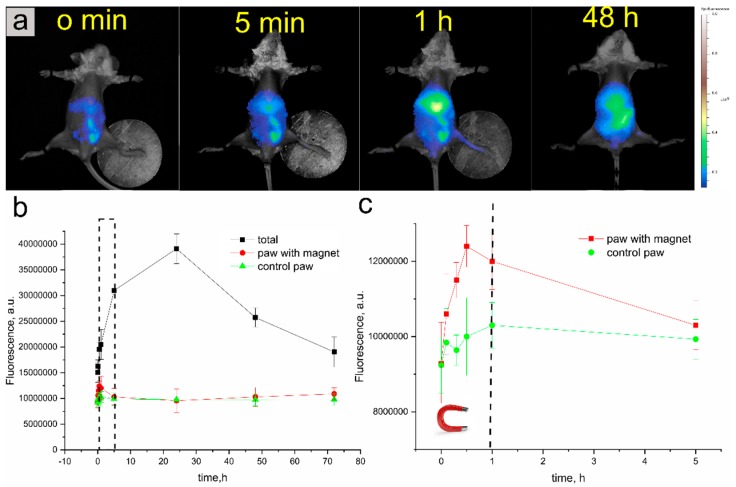
The organ distribution of carriers under the effect of a magnetic field applied to a mouse paw (real-time visualization). (a), whole-body fluorescence imaging and distribution of carriers before and after injection into the mouse tail vein. (b), change in the total fluorescence signal of the mouse and signals received from both paws within 72 h. (c), change in the fluorescence signal from the moment of carrier administration to 5 h (area marked with a dotted red line in Figure 4b).

