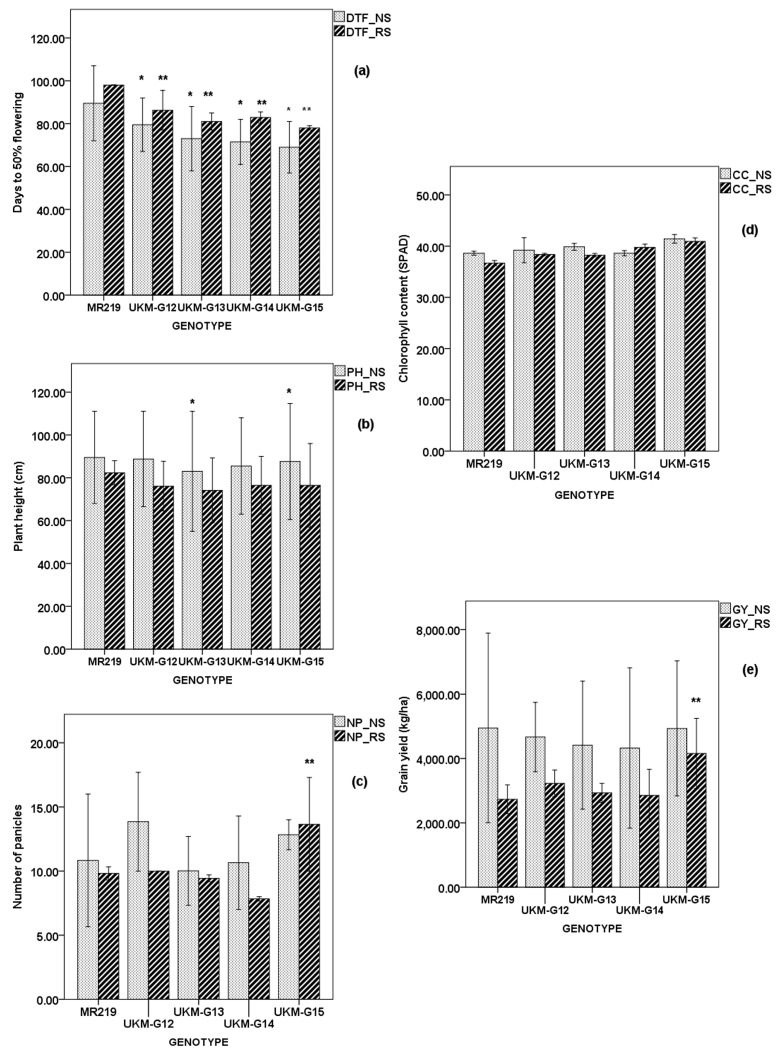
Figure 3.
Average of mean of MR219 population for two seasons under NS and RS. (a) Days to 50% flowering, (b) Plant height (cm), (c) Number of panicles, (d) Chlorophyll content, (e) Grain yield (kg/ha). * Significant difference from MR219 under NS; p < 0.05, ** Significant difference from MR219 under RS; p < 0.05. Error bar: ± standard error (SE).

