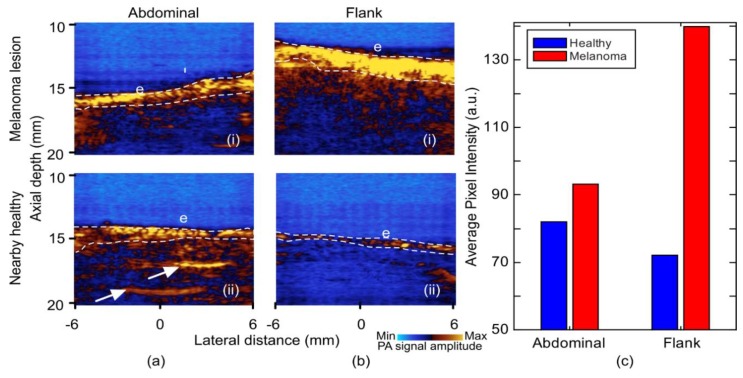
Figure 7.
Photoacoustic images of melanoma lesion and nearby healthy skin at 1064 nm illumination wavelength. (a) Abdominal: (i) Lesion and (ii) healthy. (b) Flank: (i) Lesion and (ii) healthy. (c) Bar chart of average pixel intensity from epidermal region at 1064 nm images. E: Epidermis. Fibrotic septa (arrows); averaged epidermal pixels (white dashes).

