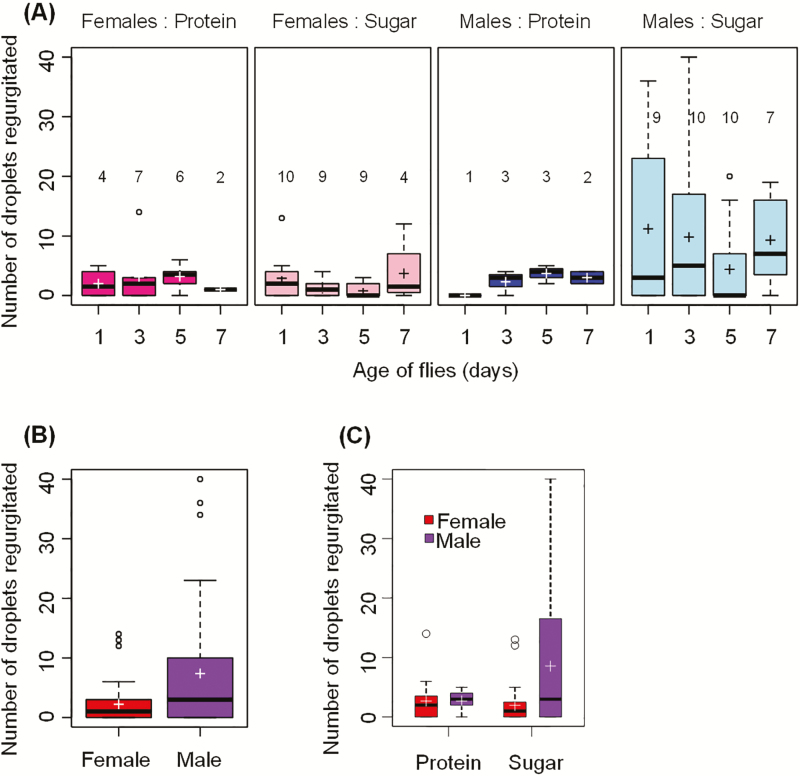
Fig. 12.
(a) Boxplots of the number of droplets regurgitated by A. ludens females and males aged 1–7 d fed on protein or sugar solutions; (b) Boxplot of the number of droplets regurgitated by A. ludens females and males regardless of their age and the type of food they consumed; (c) Boxplot of the number of droplets regurgitated as a function of the type of food consumed and the sex of flies. The boxes extend from the 25% to the 75% quartile, and the horizontal line in each box indicates the median. Whiskers indicate the minimum and maximum values; if there are outliers (circles beyond whiskers), the whiskers indicate 1.5 times the size of the hinge, which is the 75% minus 25% quartiles. The cross indicates the mean. The numbers above each box in (A) indicate the number of flies that ate (out of 10 flies) at each age in a 3-h period.

