Figure 7.
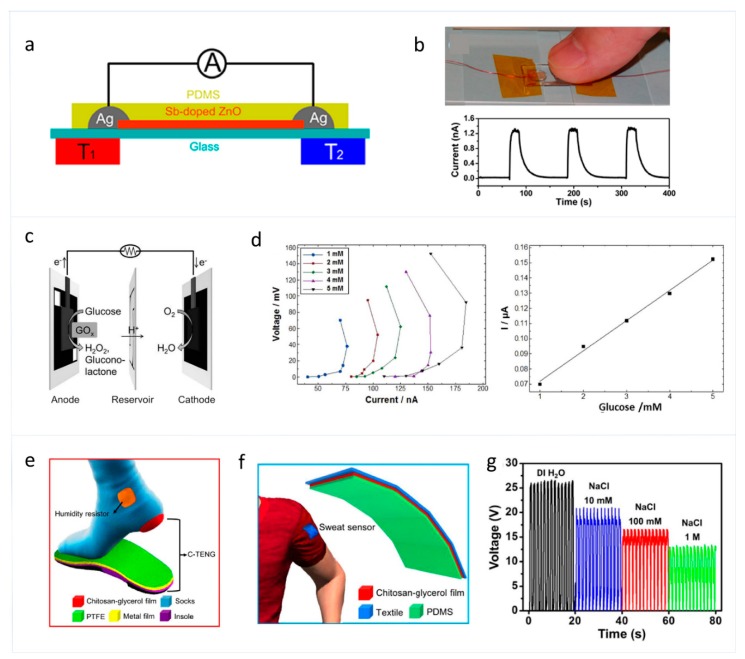
(a) Schematic diagram of a single Sb-doped ZnO microbelt nanogenerator. (b) Optical image showing a finger touching an electrode of the nanogenerator and its corresponding output current [46]. Copyright 2012, American Chemical Society. (c) Schematic illustration of the structure of the biofuel cell. (d) Diagrams of polarization curves with different concentrations of glucose, and calibration curve of output current versus the concentration of glucose in mM with a 1 MΩ resistor connecting the device’s electrical leads [47]. Copyright 2018, Elsevier. (e) The schematic illustration of the TENG connected on socks. (f) Schematic structure of the self-powered sweat sensor on commercial fabrics. (g) Output voltage of the sweat sensor when detecting clothes adsorbed with NaCl solution with various concentrations [48]. Copyright 2018, Elsevier.

