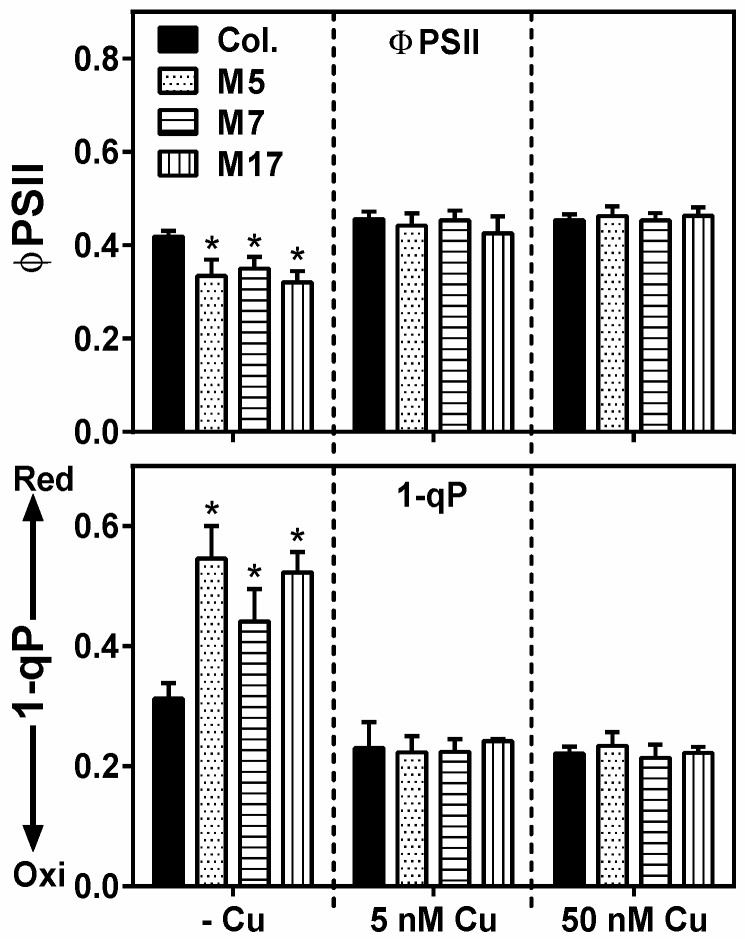
Figure 4.
Photosynthetic electron transport parameters as measured by chlorophyll fluorescence. FluorCam measurement done on dark-adopted rosette leaves from WT (Col.) and transgenic lines (M5, M7, M17) growing in hydroponic culture at 0, 5, or 50 nM CuSO4, where values are given as averages ± SD (n = 6). Top panel: ΦPSII (estimate of electron transport). Bottom panel: 1-qP (indicative of the redox state of the plastoquinone pool). * indicate significant differences between lines within a growth condition (p < 0.05, Student’s t-test).

