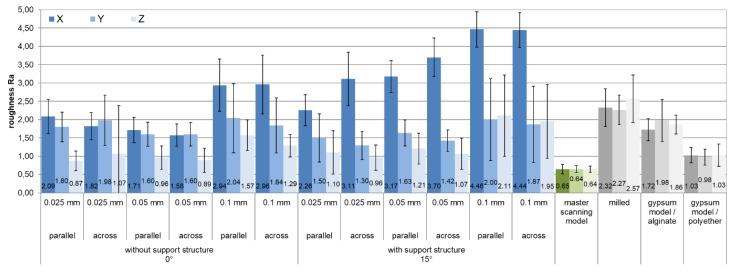
Figure 5.
Mean values of surface roughness Ra as a function of various printing parameters in comparison with the reference models and the master model; all dimensions are in µm. X, Y, Z: measurement directions (see Figure 4, values of the measurement directions X1/X2, Y1/Y2, and Z1/Z2 were summarized); parallel/across: models’ alignment to the printer’s front (see Figure 2).

