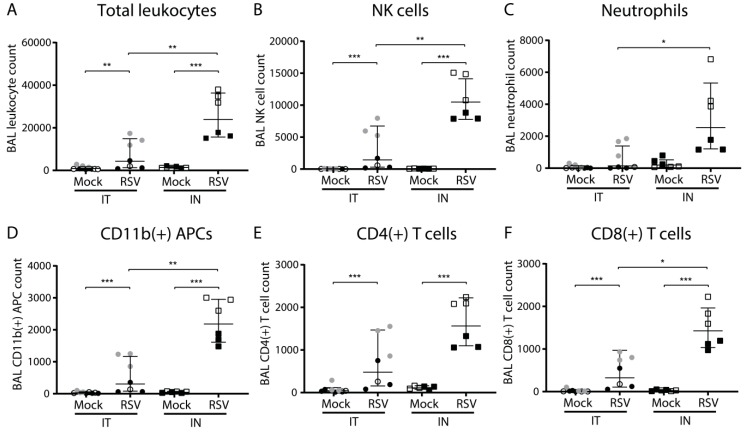
Figure 2.
Pulmonary cellular influx following intratracheal or intranasal RSV infection. Mice were (mock) inoculated either intratracheally or intranasally with 2 × 10⁶ pfu of live RSV-A2 or vehicle control. Cells were isolated from the bronchoalveolar lavage (BAL) and analyzed using flow cytometry. Mice from individual experiments are indicated with a distinct symbol (IT: white/gray/black circles; IN: white/black squares). Graphs depict absolute cell counts for: (A) total leukocytes (CD45+), (B) NK cells (CD3-, CD56+), (C) neutrophils (CD3-, Ly-6G+, CD11b+), (D) antigen-presenting cells (CD3-, Ly-6G-, CD11b+), (E) CD4 T cells (CD3+, CD4+), and (F) CD8 T cells (CD3+, CD8+). All graphs depict geometric mean and SD. Cell count data were log transformed before analysis with a one-way ANOVA, followed by Tukey’s multiple comparisons test (* p < 0.05, ** p < 0.01, *** p < 0.001). Abbreviations: APCs, antigen-presenting cells; BAL, bronchoalveolar lavage; IN, intranasal; IT, intratracheal; NK cells, natural killer cells; RSV, respiratory syncytial virus; SD, standard deviation.

