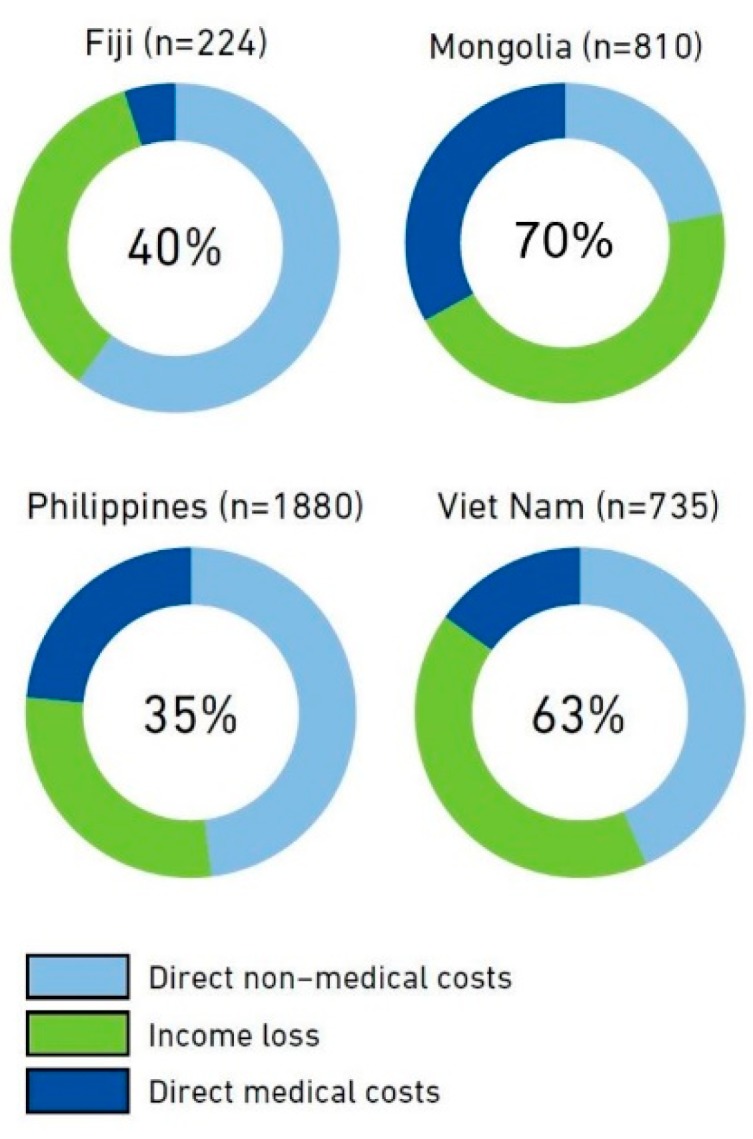
Figure 2.

Results from the Fiji, Mongolia, Philippines, and Vietnam national surveys of costs faced by TB patients and their households, implemented 2016–2018. The number in the center of the circle is the best estimate of the percentage of TB patients and their households that experienced total costs that were above 20% of their annual income (i.e., catastrophic total costs). The outer ring shows the distribution of costs in three major cost categories. The number of TB patients included in each survey is shown after the country name. Source: Global Tuberculosis Report 2018, World Health Organization.
