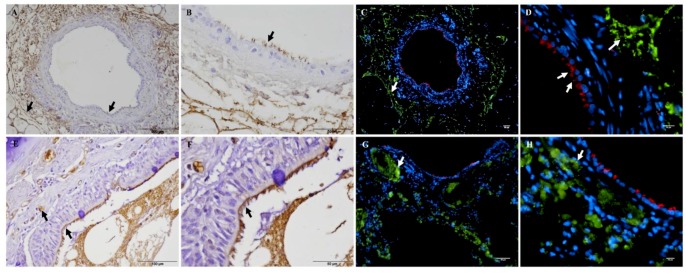
Figure 3.
Comparison of sub-bronchiolar distribution and cell tropism of Mmc GM12 in caprine PCLS and lungs of experimentally infected goats. Sub-bronchiolar distribution of Mmc GM12 in caprine PCLS, 96 hpi (A–D) and goats infected with Mmc GM12 (E–H). IHC of caprine PCLS 96 hpi showed a high amount of Mmc GM12 in the sub-bronchiolar tissue (A, black arrows) and a close-up view of the same sample (B, black arrows), revealing complete coverage of ciliated cells with Mmc GM12. Seriate sections were stained with IF and were comparable to the IHC analysis (C,D, white arrows). Comparison of PCLS with lungs of experimentally infected goats showed similar results in IHC (E,F, black arrows) and IF (G,H, white arrows). Red: β-tubulin of ciliated cells, Green: Mmc, Blue: Nuclei of caprine cells. Scale bars: A = 200 µm, B, C, F and G = 50 µm, D and H = 10 µm, E = 100 µm.

