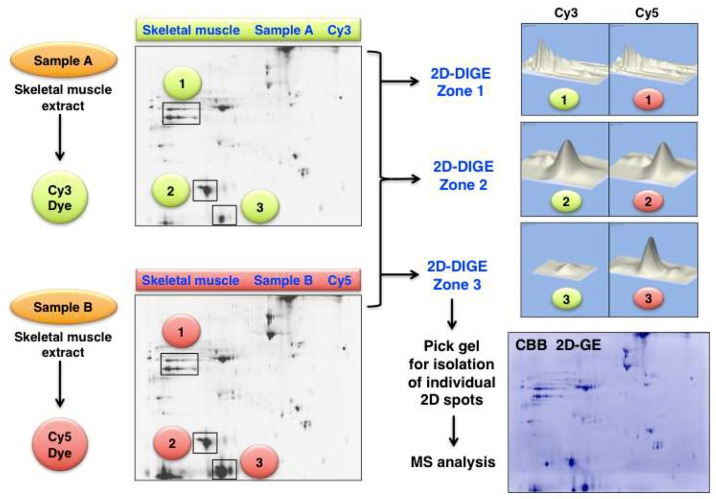
Figure 6.
Fluorescence two-dimensional difference in-gel electrophoresis (2D-DIGE) of human gastrocnemius muscle. The 2DGE images on the left show Cy3 (Sample A) versus Cy5 (Sample B) labelled and separated muscle proteins. The densitometric analysis of the marked 2D-DIGE Zones 1 to 3 is shown on the right and depicts clusters of mostly unaltered proteins (Zone 1 and 2) versus significantly altered expression levels (Zone 3). The routine identification of distinct proteoforms is performed by MS analysis of individual 2D spots from Coomassie Brilliant Blue (CBB) stained pick gels.

