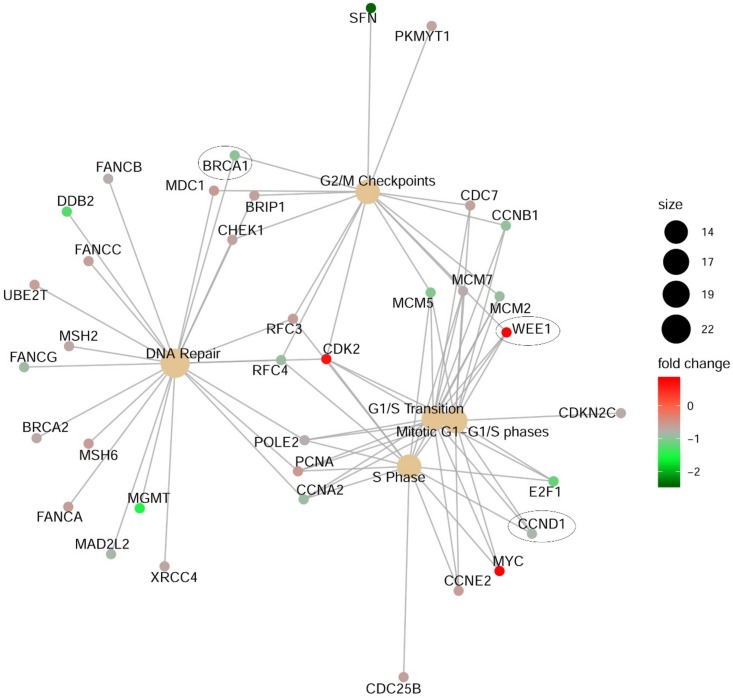
Figure 4.
Signaling pathway nodes effected by loss of CDK11 in A375 melanoma cells following PanCancer Reactome pathways analysis. A375 cells were transfected with siRNA directed against CDK11 or control siRNA. After 48 h, cells were collected for RNA purification. Gene names with an ellipse drawn around them represent genes that were similarly altered in both A375 and WM1366 cells after q-RT-PCR verification. Fold change in gene expression is indicated by the red (increased) to green (decreased) scale shown. Node circle size represents the number of genes altered in that pathway.

