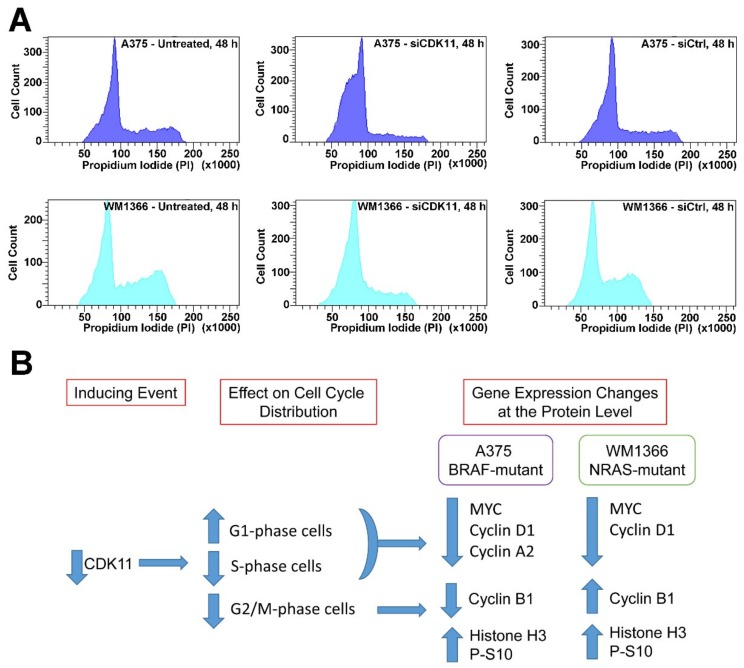
Figure 6.
FACS analysis for cell cycle composition following siRNA-mediated down-regulation of CDK11 in melanoma cells and summary of cell cycle-related results. (A) PI-based FACS analysis for DNA content in untreated and siCDK11 and siControl transfected A375 (upper panels) and WM1366 (lower panels) cells is shown. The identity of the treatment type and time point is indicated within each panel. (B) A cartoon summary of the cell cycle-based alterations in melanoma cells after CDK11 downregulation and the associated changes in protein expression levels.

