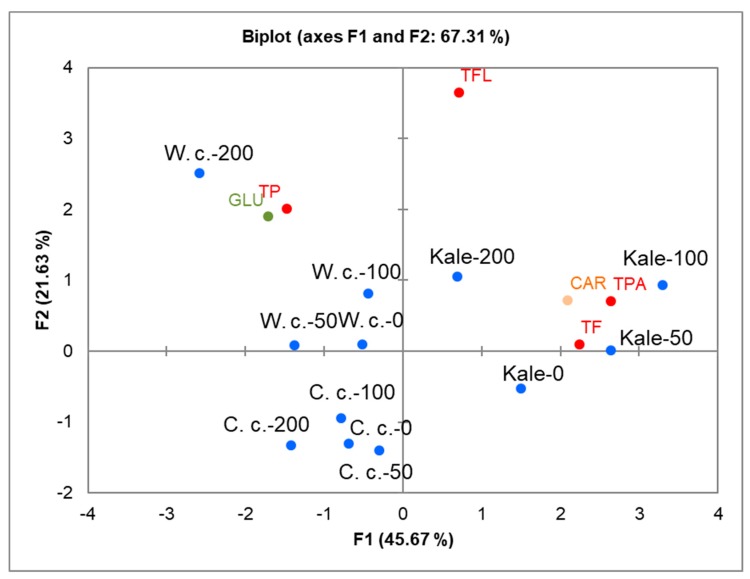
Figure 4.
Two-dimensional principal component analysis (2D-PCA) of specialized metabolites in Chinese cabbage (C. c), white cabbage (W. c.), and kale (Kale) after 24 h exposure to 0 (control), 50, 100, and 200 mM NaCl. The green, orange, and red symbols indicate the positions in the score plots of glucosinolates (GLU), carotenoids (CAR), and phenolic compounds (total phenolics (TP), total flavonoids (TF), total phenolic acids (TPA), total flavonols (TFL)), respectively. The blue symbols indicate the positions of the Brassica crops following each of the treatments. PCA was created based on data presented in Supplementary Table S1. The correlation matrix used, eigenvalues, factor loadings, and factor scores are given in Supplementary Tables S2–S6.

