
Fig. 2. Proteins biotinylated by Merlin-BirAR118G.
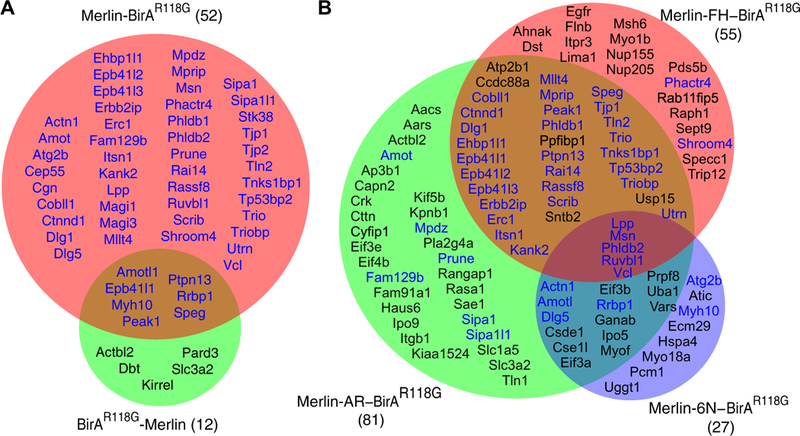
(A) Venn diagram showing the 52 proteins from cells expressing Merlin-BirAR118G (pink) and the 12 proteins from cells expressing BirAR118G-Merlin (green) that met the selection criteria for Merlin interaction by proximity biotinylation followed by mass spectroscopy. (B) Venn diagram showing the 55 proteins from cells expressing Merlin-FH–BirAR118G, 81 proteins from cells expressing Merlin-AR-BirAR118G, and 27 proteins from cells expressing Merlin-6N–BirAR118G that met the selection criteria for Merlin interaction by proximity biotinylation followed by mass spectroscopy. Proteins shown in blue were also identified in the Merlin-BirAR118G dataset in (A).