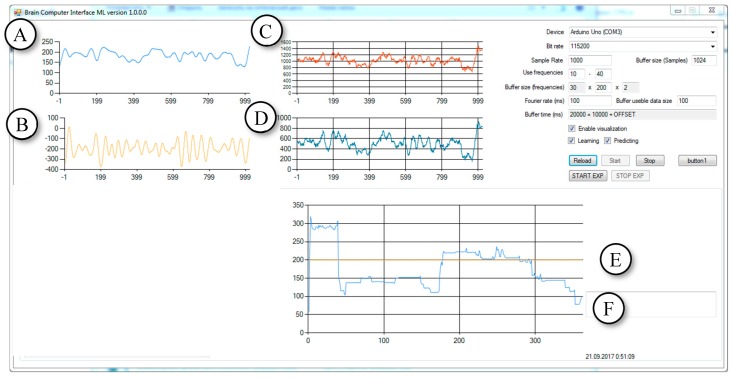
Figure 7.
The Brain Computer Interface ML Version 1.0.0.0 program evaluates the amplitude of the alpha rhythm. (Experiment eyes open (EO)/eyes closed (EC). Light blue (A)—alpha waves. Yellow (B)—beta 1 waves. Red (C) and cyan (D) are raw EEG in a different scale. Yellow (E)—graph displaying the status of the experiment in accordance with the scale of the A/EEG ratio graph. Light blue (F)—alpha/raw EGG amplitude ratio (multiplied by 1000). (Opened eyes—value is 100, closed eyes—value is 200).

