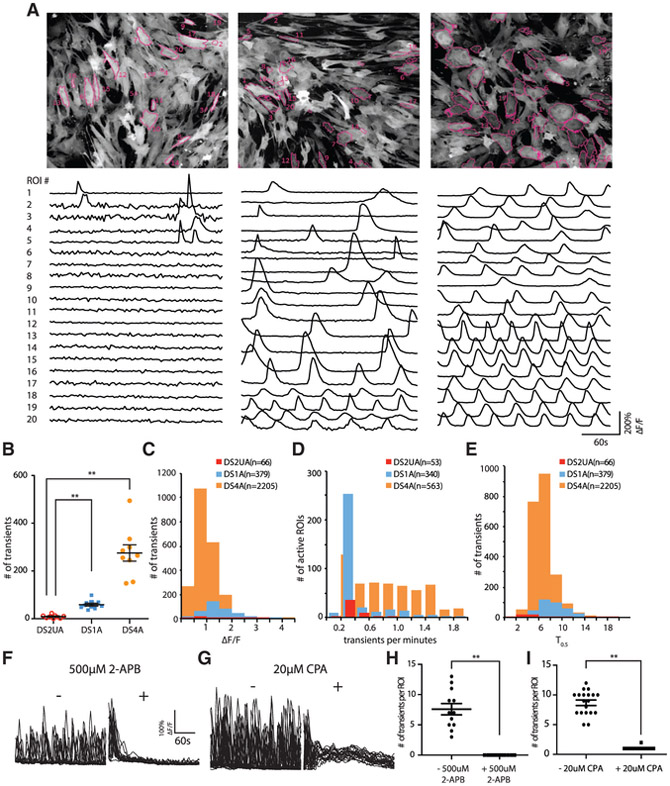
Figure 2. Imaging Ca2+ Events in Human-iPSC-Derived Isogenic and DS Astroglia.
(A) Spontaneous Ca2+ responses in isogenic DS2UA and two DS astroglia (DS1A and DS4A). Representative ROIs (n = 20) in the field of view showing Ca2+ fluctuations in DS2UA, DS1A, and DS4A. All ROIs were detected using FASP and marked with magenta outlines. The scale bar represents 100 μm.
(B) DS1A and DS4A displayed a significantly increased number of Ca2+ fluctuations in 5 min of imaging sessions compared with DS2UA (9 independent imaging sessions).
(C–E) Features of Ca2+ fluctuations in DS astroglia: averaged kinetics (C), frequency (D), and propagation speed (E) of DS astroglia. Data were collected from 81 cells of DS1A and 188 cells of DS4A.
(F–I) The Ca2+ fluctuations in DS4A could be abolished by incubation with IP3R antagonist (500 μM 2-APB; 17 ROIs; F and H) ordepleting ER Ca2+ store (20 μM CPA; 23 ROIs; G and I).
Error bars are shown as mean ± SEM, *p < 0.05, **p < 0.01.

