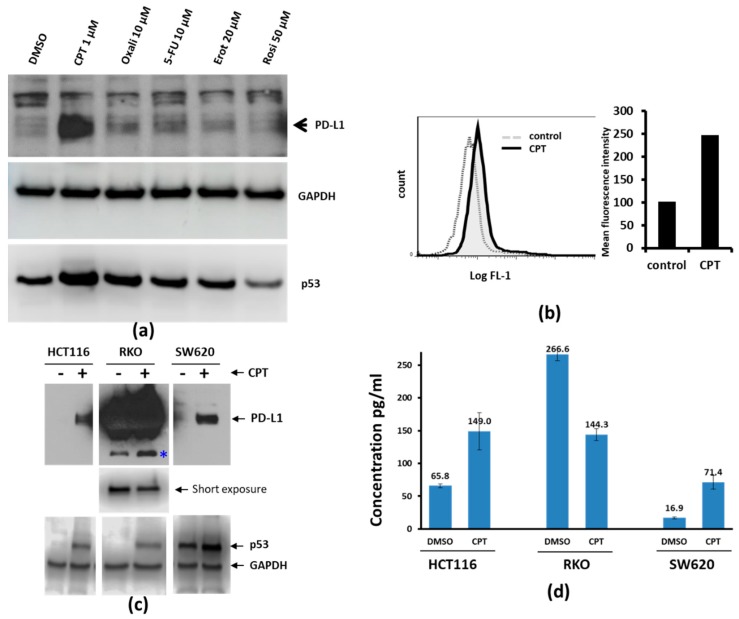
Figure 1.
Camptothecin (CPT) treatment increases the expression of PD-L1. (a) SW620 colon cancer cells were treated with either vehicle or the indicated drugs for 24 h. Cell lysates were probed for the expression of Programmed Death-Ligand 1 (PD-L1) and p53. GAPDH was probed to compare the total protein loaded on the gel. Among the compounds tested under these experimental conditions, CPT was the best inducer of both PD-L1 and p53. (b) PD-L1 detection by flow cytometry. SW620 cells were treated with 1 µM CPT for 24 h, and the expression of PD-L1 was analyzed by flow cytometry. The solid black line in the left panel indicates the right shift in the fluorescence (FL1) peak, indicating increased expression of PD-L1 compared to control (dashed line). Quantification of the mean relative intensity for PD-L1 in control or CPT-treated SW620 cells is shown in a bar graph (right panel). Numbers below each panel indicate the relative integrated density of the protein band in that lane. (c) The three colorectal cancer (CRC) cell lines were treated with 1 µM CPT for 24 h, and cell lysates were examined for PD-L1 expression. The upper panel shows immunoblots for PD-L1. Due to the high levels of PD-L1 in RKO cells (middle panel), the protein bands were over-exposed. The middle panel shows a brief re-exposure of the PD-L1 immunoblot to show the levels of PD-L1. The lower panel shows immunoblot bands for p53 to indicate drug response and GAPDH for a loading control. * a possible cleavage product of PD-L1 in RKO cells. (d) ELISA assay for the determination of PD-L1 response in colon cancer cells. Cell lysates from DMSO- or CPT-treated cells were analyzed for PD-L1 levels by ELISA. HCT116 and SW620 lysates were loaded at 40 µg total protein per well, whereas 4 µg total protein was loaded per well for RKO cell lysates. The Y-axis and numbers above the columns of the bar graph indicate concentrations in pg/mL. Lysates were assayed in duplicate. Error bars show the standard variation from the mean.

