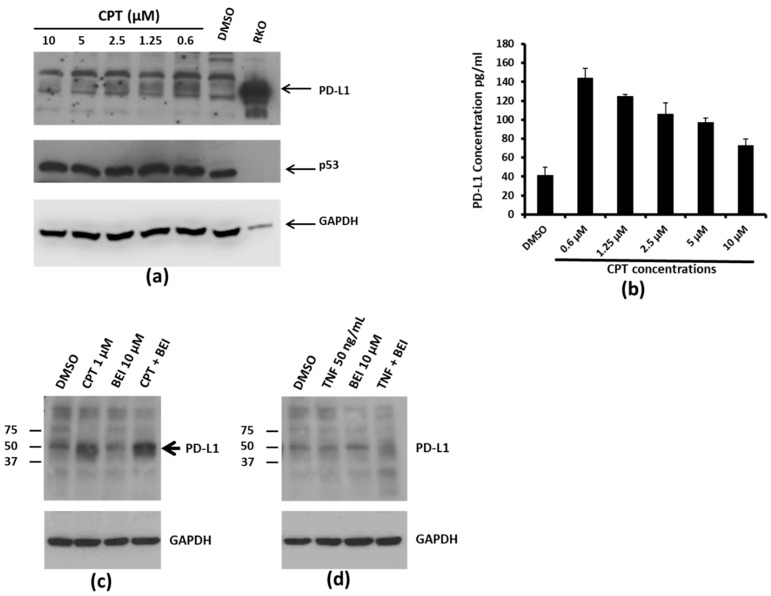
Figure 2.
PD-L1 expression in response to CPT treatment. (a) SW620 cells were treated with the indicated concentrations of CPT for 24 h. The levels of PD-L1 in the cell lysates were evaluated by immunoblotting. p53 and GAPDH levels were also detected in the same lysates for drug response and for loading control, respectively. The RKO lysate was loaded on the same gel as a marker for detection of PD-L1, since RKO cells expressed the highest amounts of the protein per unit volume of lysate. Numbers below each panel indicate the relative integrated density of the protein band in that lane. (b) Cell lysates from SW620 cells treated with DMSO or increasing concentrations of CPT were prepared for ELISA. For this assay, 75 µg of total protein was loaded per well. The Y-axis of the bar graph indicates concentrations in pg/mL. (c) SW620 cells were treated for 24 h with DMSO or CPT, or with CPT followed by 3-(2-bromoethyl)indole (BEI, an Nuclear Factor kappa-light-chain-enhancer of activated B cells (NF-kB) inhibitory compound) for another 24 h. The expression of PDL-1 was detected by immunoblotting using an anti-PD-L1 antibody. (d) SW620 cells were treated with DMSO, tumor necrosis factor alpha (TNFα), or TNFα and BEI. PD-L1 expression was detected by immunoblotting. Neither TNFα nor cotreatment with BEI upregulated PD-L1 expression.

