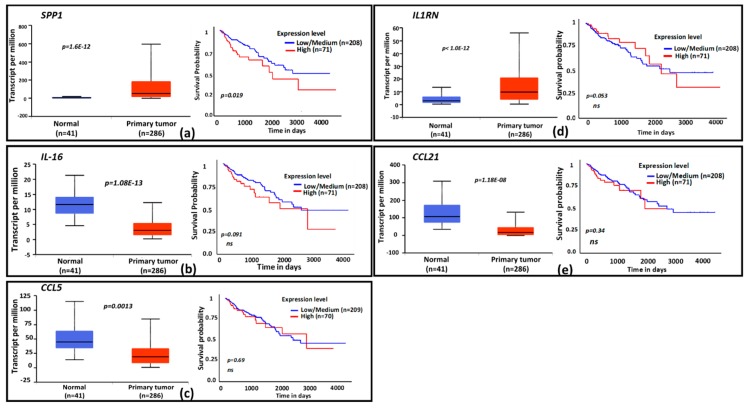
Figure 3.
Expression profiles and functional categories of CPT-responsive genes and survival prognosis based on gene expression. Cytokine genes identified as CPT-responsive were probed for clinical significance in The Cancer Genome Atlas (TCGA) database. Graphs for the 5 genes with significant expression and/or survival probability in the database are shown. (a–e), The TCGA colon adenocarcinoma (COAD) database was probed for gene expression and patient survival profiles by using the UALCAN portal. Box plots indicate relative gene expressions between normal tissues and primary tumors; line graphs are Kaplan–Meier patient survival curves for relatively low (blue) or high (red) gene expressions. Genes: (a) = SPP1, (b) = IL-16, (c) = CCL5, (d) = IL1RN, (e) = CCL21. The x-axis shows survival time in days; the y-axis shows survival probability. ns = nonsignificant. n = number of specimen analyzed for gene expression or number of patients in the survival curve computation.

