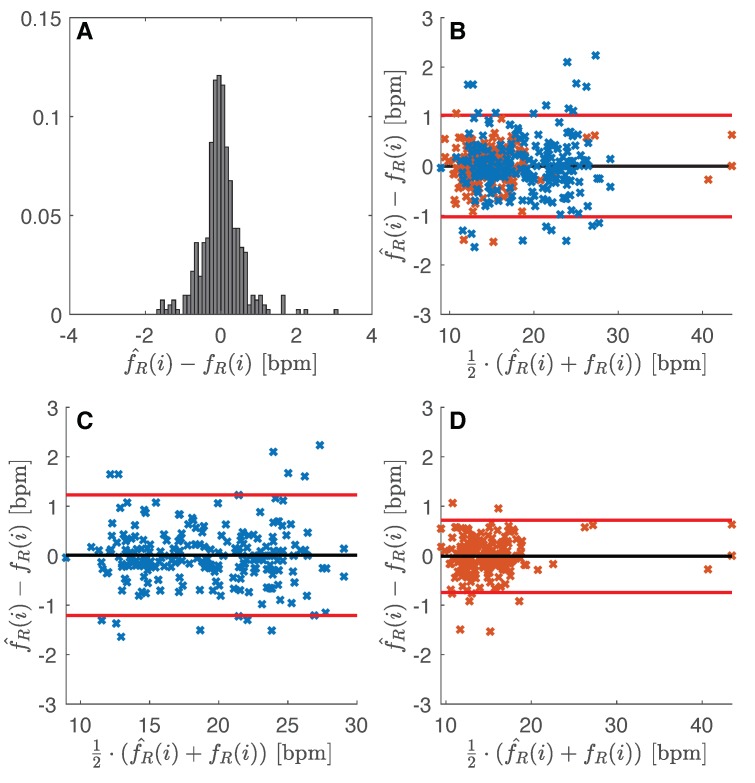
Figure 5.
(A) Difference distribution between proposed method and reference respiratory rate values; (B) Bland–Altman plot obtained considering all the data recorded by male and female volunteers: black line is the MOD, red lines are the LOAs (i.e., ±1.96 times the standard deviation); (C,B) Bland–Altman plot obtained considering data recorded by male volunteers; (D) Bland–Altman plot obtained considering data recorded by female volunteers.

