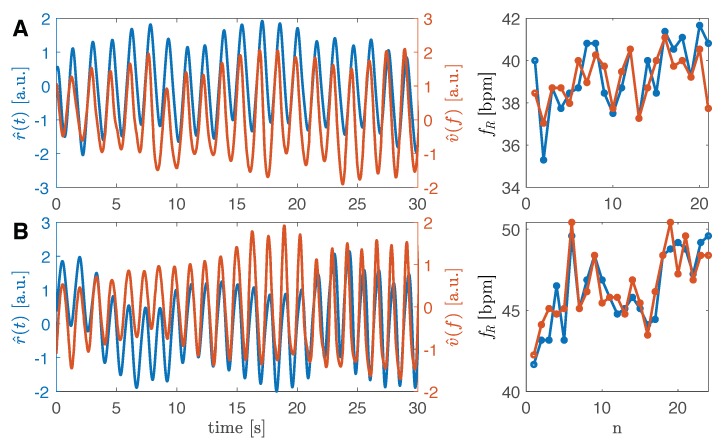
Figure 6.
Two patterns collected from two volunteers simulating tachypnea. In blue, the reference signal , in orange the signal. In the first volunteer (graphs A), the average is 39.14 bpm while the average is 39.34 bpm. In the second volunteer (graphs B), the average is 46.44 bpm while the average is 46.28 bpm.

