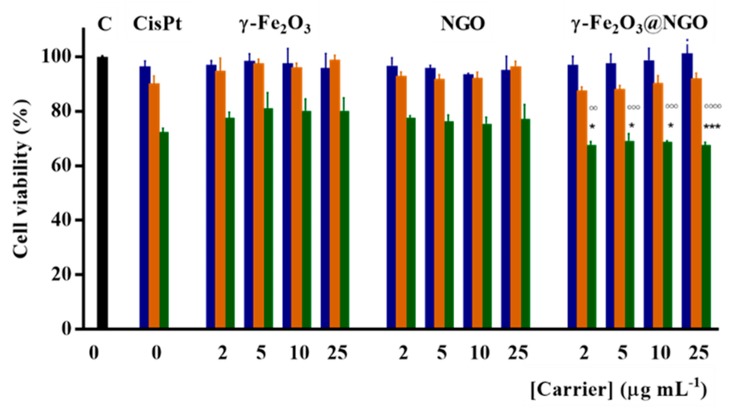
Figure 8.
U87 viability after 72 h incubation with CisPt concentrations 2.5 (blue); 5.0 (orange); and 10.0 (green) µM in the free form and after loading on γ-Fe2O3; NGO; γ-Fe2O3@NGO. Carrier concentrations were 2.0; 5.0; 10.0; and 25.0 µg mL−1. An overall p-value less than 0.05 was accepted as significant. For individual comparisons of γ-Fe2O3@NGO (10 µM CisPt) vs. γ-Fe2O3 or NGO at the same concentrations, adjusted p-values are indicate as * p < 0.05 vs. NGO; *** p < 0.001 vs. NGO; °°° p < 0.001 vs. γ-Fe2O3; °°°° p < 0.0001 vs. γ-Fe2O3. Error bars represent standard error of the mean (n = 3 independent experiments).

