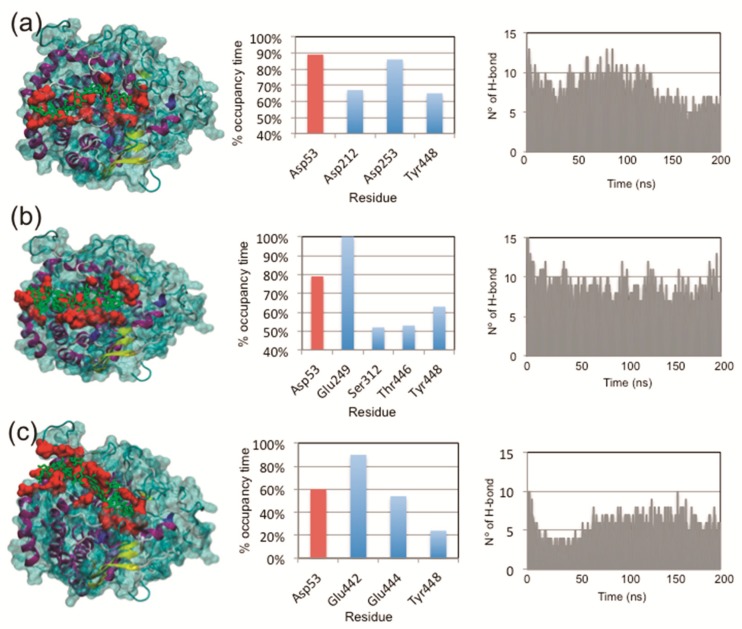
Figure 5.
MDS analyses of the interaction of FaEG1 with cellulose (a) and two hemicellulose octasaccharides: XXXGXXXG (b) and XXFGXXFG (c). In the left, a general view of the interaction of the protein and the corresponding ligand. In the center, a graph indicating the percentage of time that a hydrogen bond between particular amino acid residues and the ligand is established; the catalytic residues are shown in red. On the right are the number of hydrogen bonds established during MDS between the ligand and different amino acid residues located in the open groove of each protein model. Only values greater than or equal to 40% frequency are shown in the center graph to (a) and (b) graphics, while the values greater than or equal to 10% frequency are shown in the (c) center graph.

