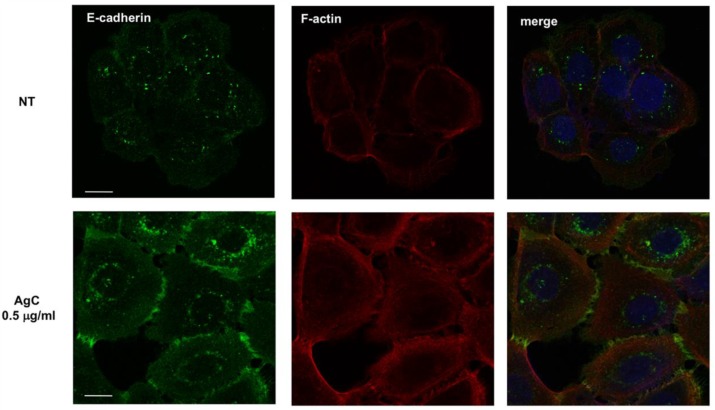
Figure 5.
E-cadherin localization in HaCaT cells upon AgC treatment. Cells were allowed to adhere onto coverslips for 24 h and then treated with 0.5 μg/mL AgC for 8 h. Cells were then fixed and subjected to IF with an anti-E-cadherin antibody followed by TRITC-conjugated phalloidin to visualize the actin cytoskeleton. Representative images of E-cadherin subcellular localization and phalloidin are shown. Merged images also show DAPI staining to visualize the nuclei. Images were taken with a Zeiss confocal laser-scanning microscope Axio Observer (scale bar, 15 μM). A ×40 objective was used and image analysis was performed using ImageJ.

