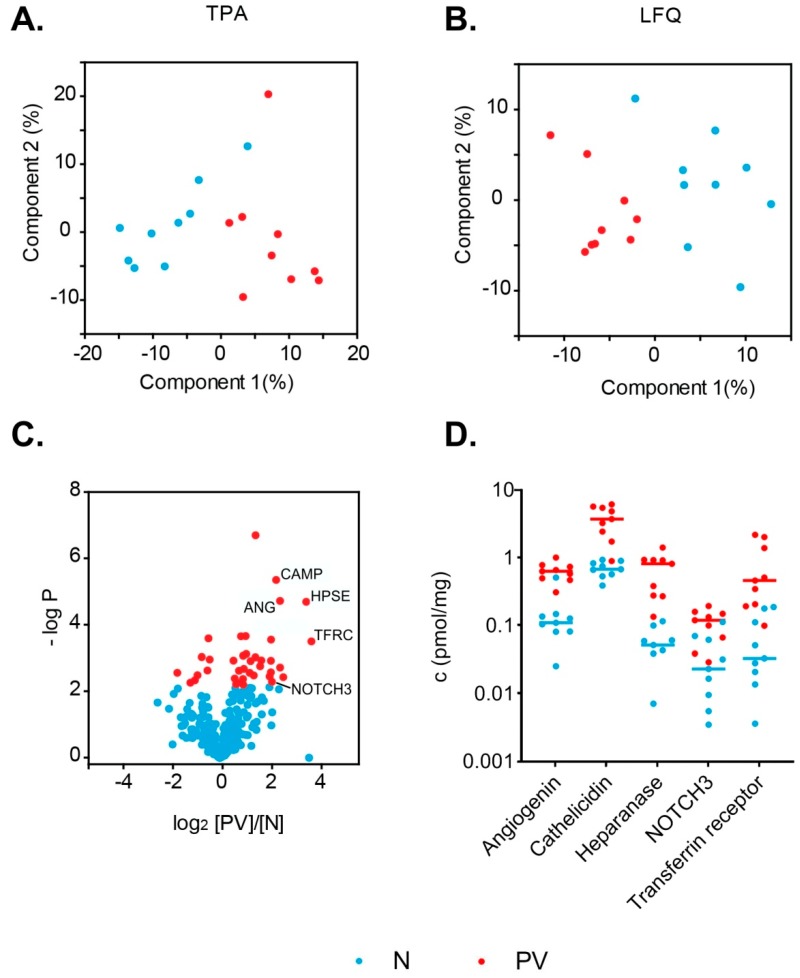
Figure 4.
Results of statistical t-test analysis conducted for two groups of samples: PV patient samples and healthy volunteer samples: PCA plots for study samples created from the results of two computational quantitative approaches, (A) the TPA and (B) Max Quant LFQ quantification; (C) the volcano plot showing the experimental outlier proteins (38 proteins); (D) concentration plot of six outlier proteins differentiating across the samples (angiogenin–ANG, cathelicidin antimicrobial peptide–CAMP, heparanase—HPSE, neurogenic locus notch homolog protein 3–NOTCH3, and transferrin receptor protein 1—TFRC).

