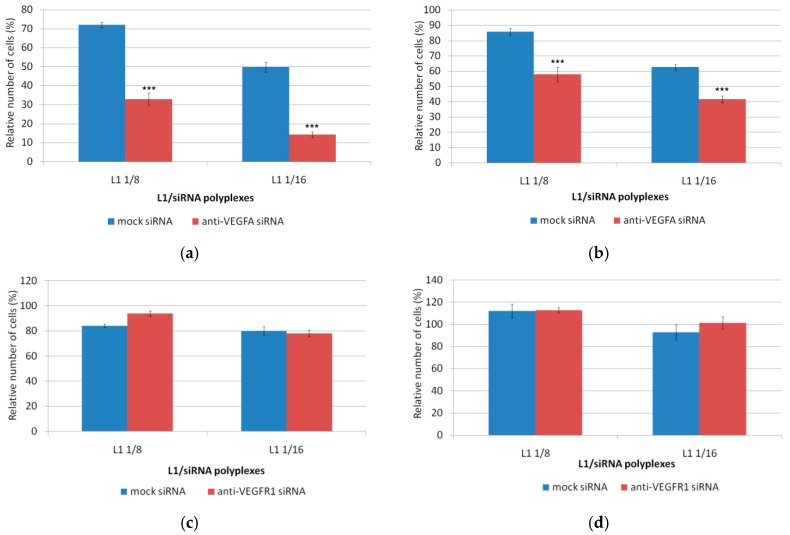
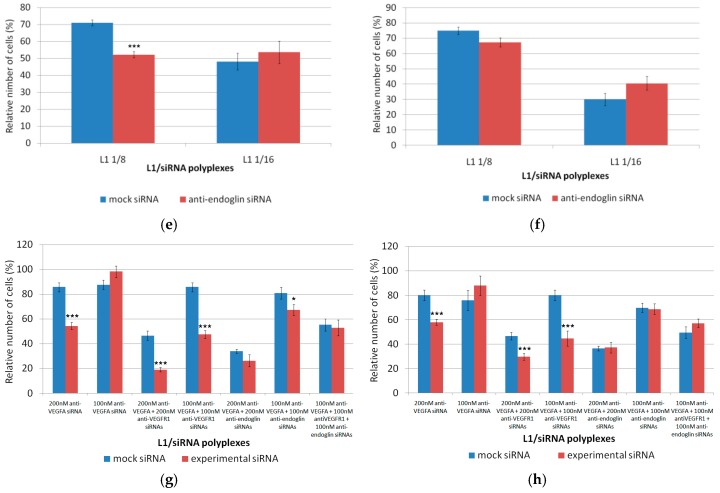
Figure 6.
Number of EA.Hy926 cells after treatment with L1/anti-VEGFA siRNA (a,b), L1/anti-VEGFR1 siRNA (c,d), L1/ anti-endoglin siRNA (e,f), and L1/mixed siRNA complexes (g,h) analyzed using Alamar blue assay (a,c,e,g) and by crystal violet assay (b,d,f,h); * p < 0.05, *** p < 0.001 when compared with cells treated using mock siRNA.


