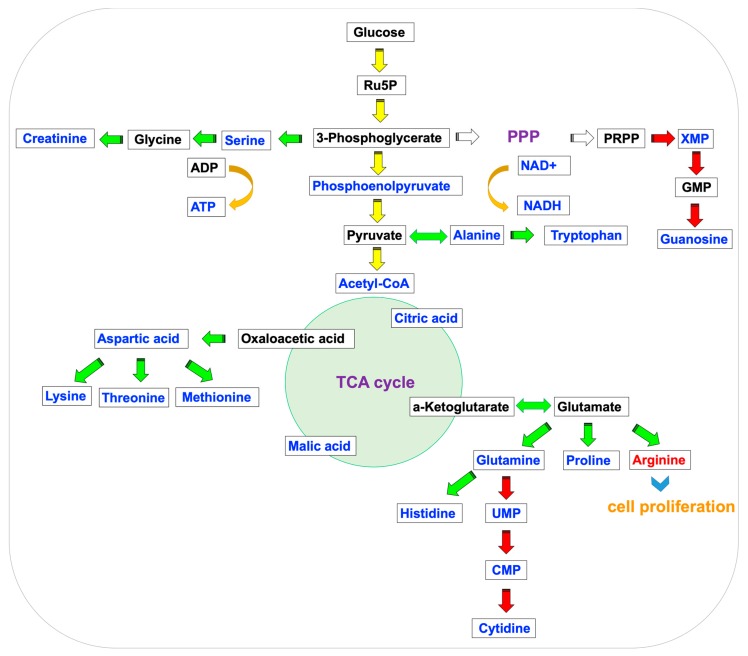
Figure 4.
Illustration of the central metabolic pathway in 24-h TCDD-treated Huh-7 cells. The glycolytic pathway (yellow), amino acid metabolism (green), and nucleic acid metabolism (red) are shown. The red and blue color of the metabolites represent increasing or decreasing in the treatment group compared with the control group.

