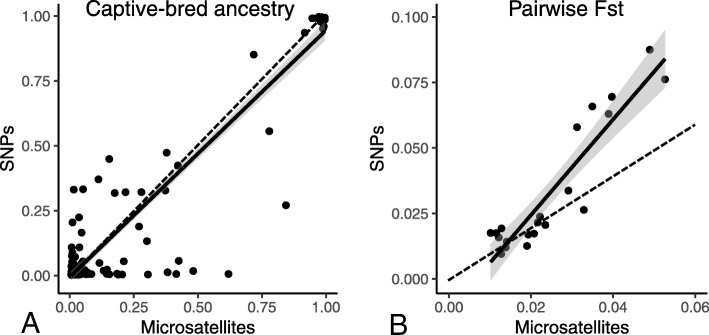
Fig. 3.
Plot of individual hatchery ancestry proportion measured with microsatellites against that measured with SNPs (a) and pairwise Fst between sites measured with microsatellites against pairwise Fst between sites measured with SNPs (b). Black lines represent the linear regression with its confidence interval; spotted lines represent the 1:1 line

