Fig. 3.

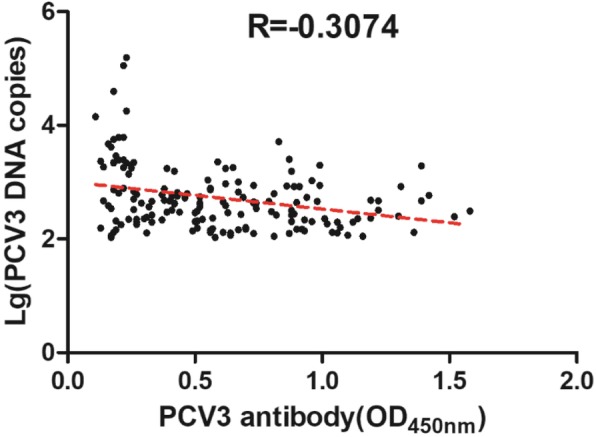
Correlation analysis between the levels of PCV3 DNA (lg DNA copies) and anti-PCV3-capsid antibody response (shown as OD450nm) in 165 pig serum samples. Pearson correlation coefficient (R) is −0.3074, P < 0.0001

Correlation analysis between the levels of PCV3 DNA (lg DNA copies) and anti-PCV3-capsid antibody response (shown as OD450nm) in 165 pig serum samples. Pearson correlation coefficient (R) is −0.3074, P < 0.0001