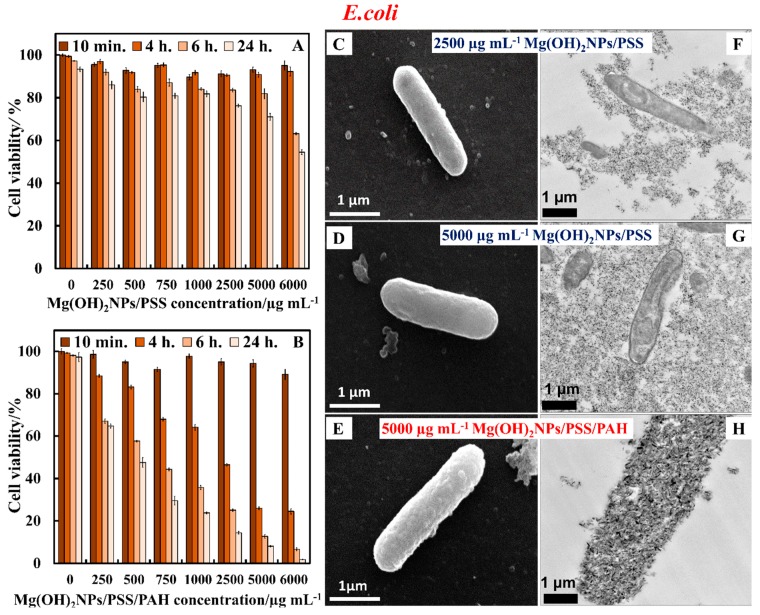
Figure 11.
The E. coli cell viability after treatment with (A) Mg(OH)2NPs/PSS and (B) Mg(OH)2NPs/PSS/PAH for various incubation times as a function of the NPs concentration. (C) SEM and (F) TEM images of E. coli after incubation with 2500 µg mL−1 Mg(OH)2NPs/PSS; (D) SEM and (G) TEM images of E. coli after incubation with 5000 µg mL−1 Mg(OH)2NPs/PSS; (E) SEM and (H) TEM images of E. coli after incubation with 5000 µg mL−1 Mg(OH)2NPs/PSS/PAH. The cells were removed from the particle suspension before the sample preparation for TEM and SEM imaging.

