Fig. 9.

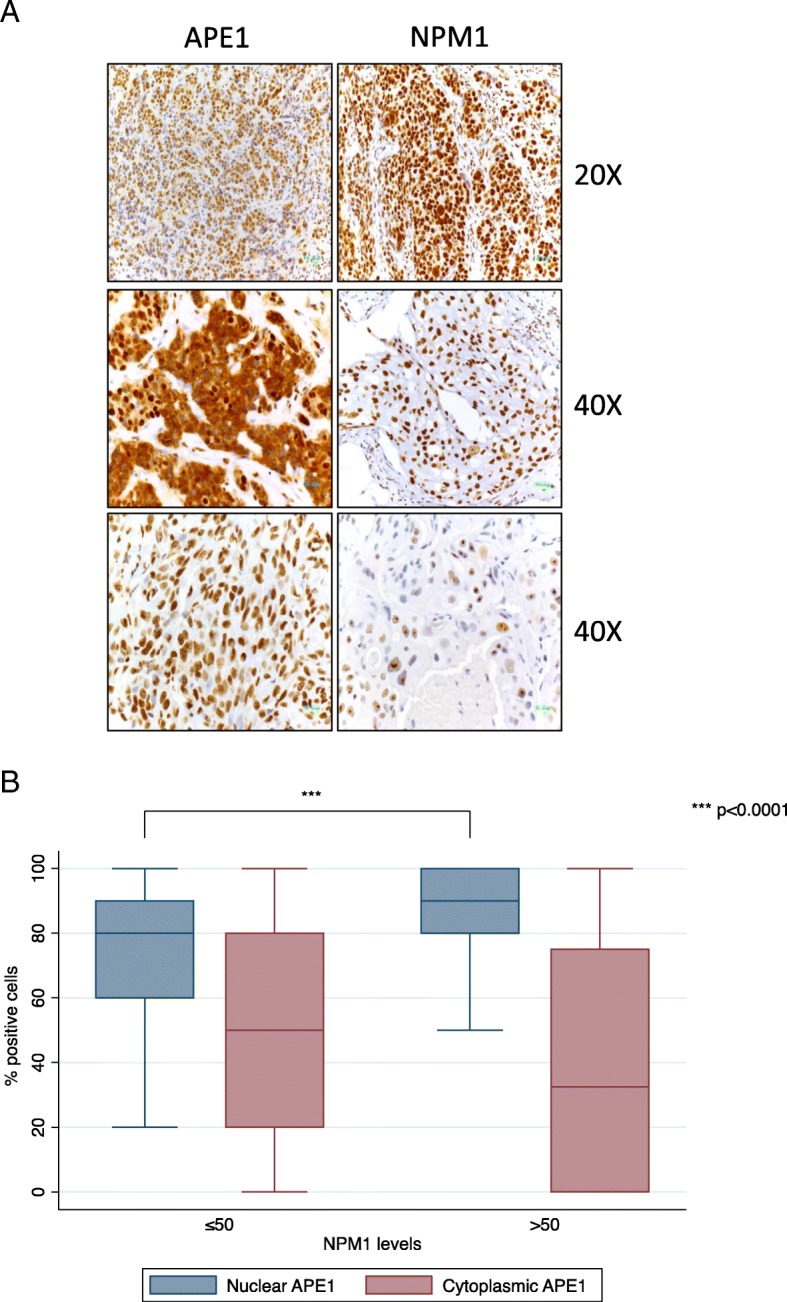
NPM1 IHC expression is associated with APE1 localization. Representative IHC samples of TNBC tumors, obtained at 20X and 40X magnification, revealing levels and localization of NPM1 and APE1 (a). Relative graph of nuclear vs cytoplasmic APE1 levels according to NPM1 (b). *** p < 0.0001 using the Mann-Whitney U test
